Flood risk
Published on
Overview
The Smart Indexes team has developed the geo-analytical map “Flood Risk Analysis” to assess locations at risk of flooding. It is based on meteorological data of extreme precipitation recorded in April 2024.
The geo‑analytical map provides a comprehensive suite of tools for working with geospatial cartography, including community listings, master project overviews, flood‑risk rankings (expressed as percentages), color‑coded map segmentation, and more.
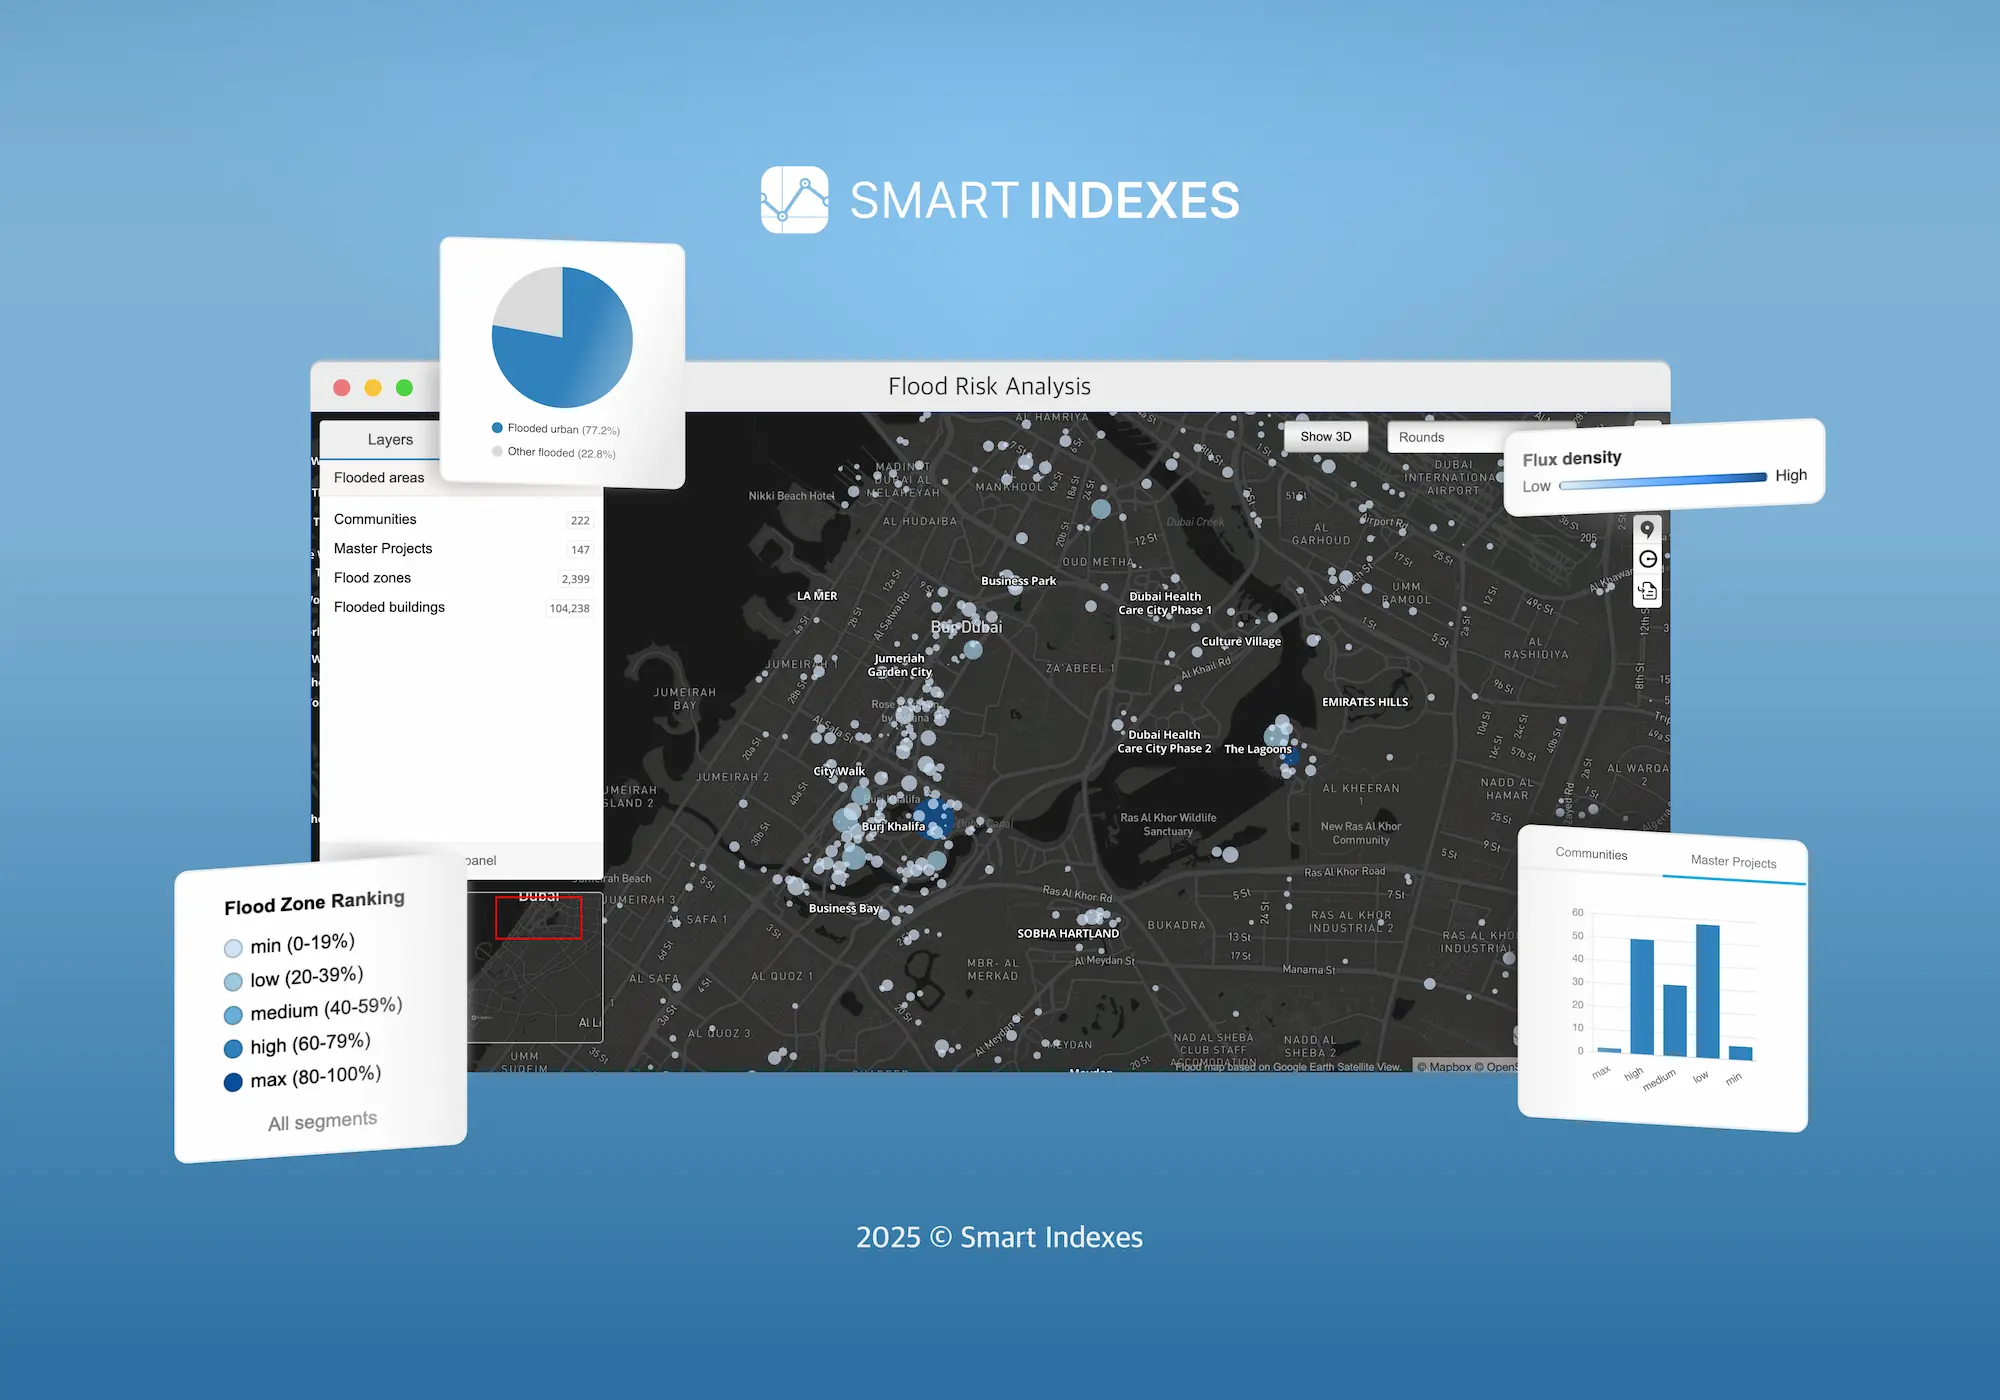 Flood Risk Analysis by Smart Indexes for location of the Emirate of Dubai
The Flood Risk metric is based on a Smart Indexes study of inundation zones in Dubai, using Google Earth satellite imagery captured before and after the April 2024 weather event.
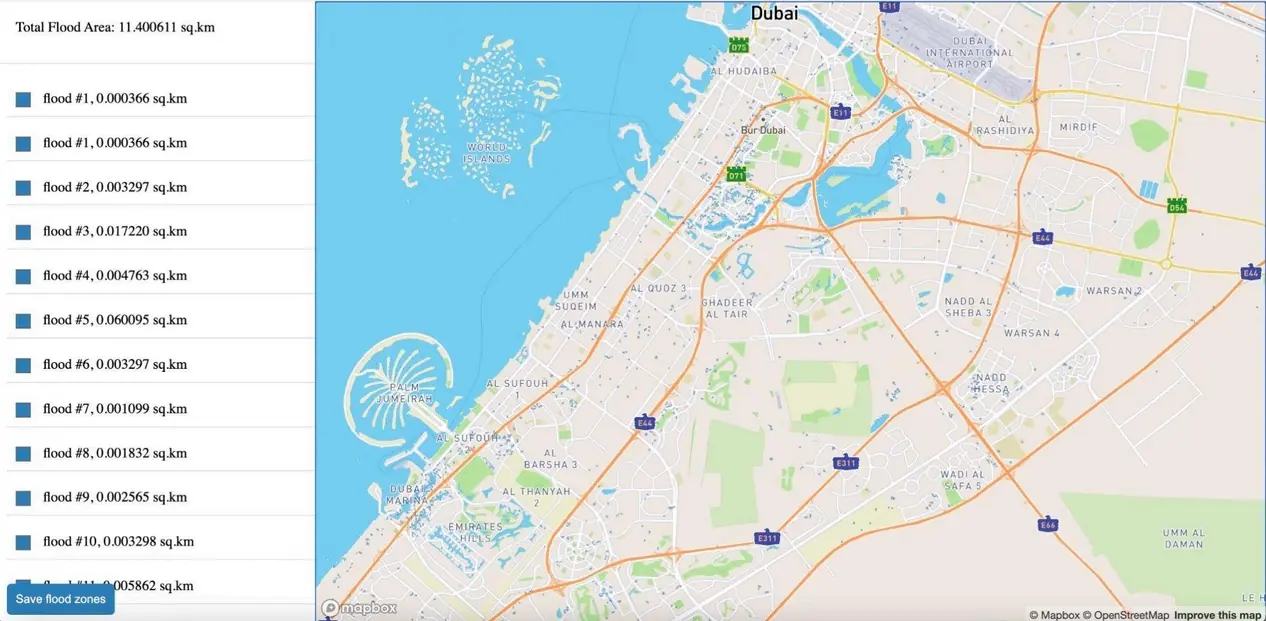 Total flood areas on Dubai map by satellite shots
See the full report, "Flood Risk Analysis for Dubai Areas Based on April 2024 Data", on our Smart Blog.
Flood Risk quantifies the likelihood of recurrence, adjusted for elevation, to help investors avoid properties in low-lying, flood-prone areas.
Risk values are segmented by community and expressed as a percentage score, simplifying interpretation when mapping investment targets in Dubai.
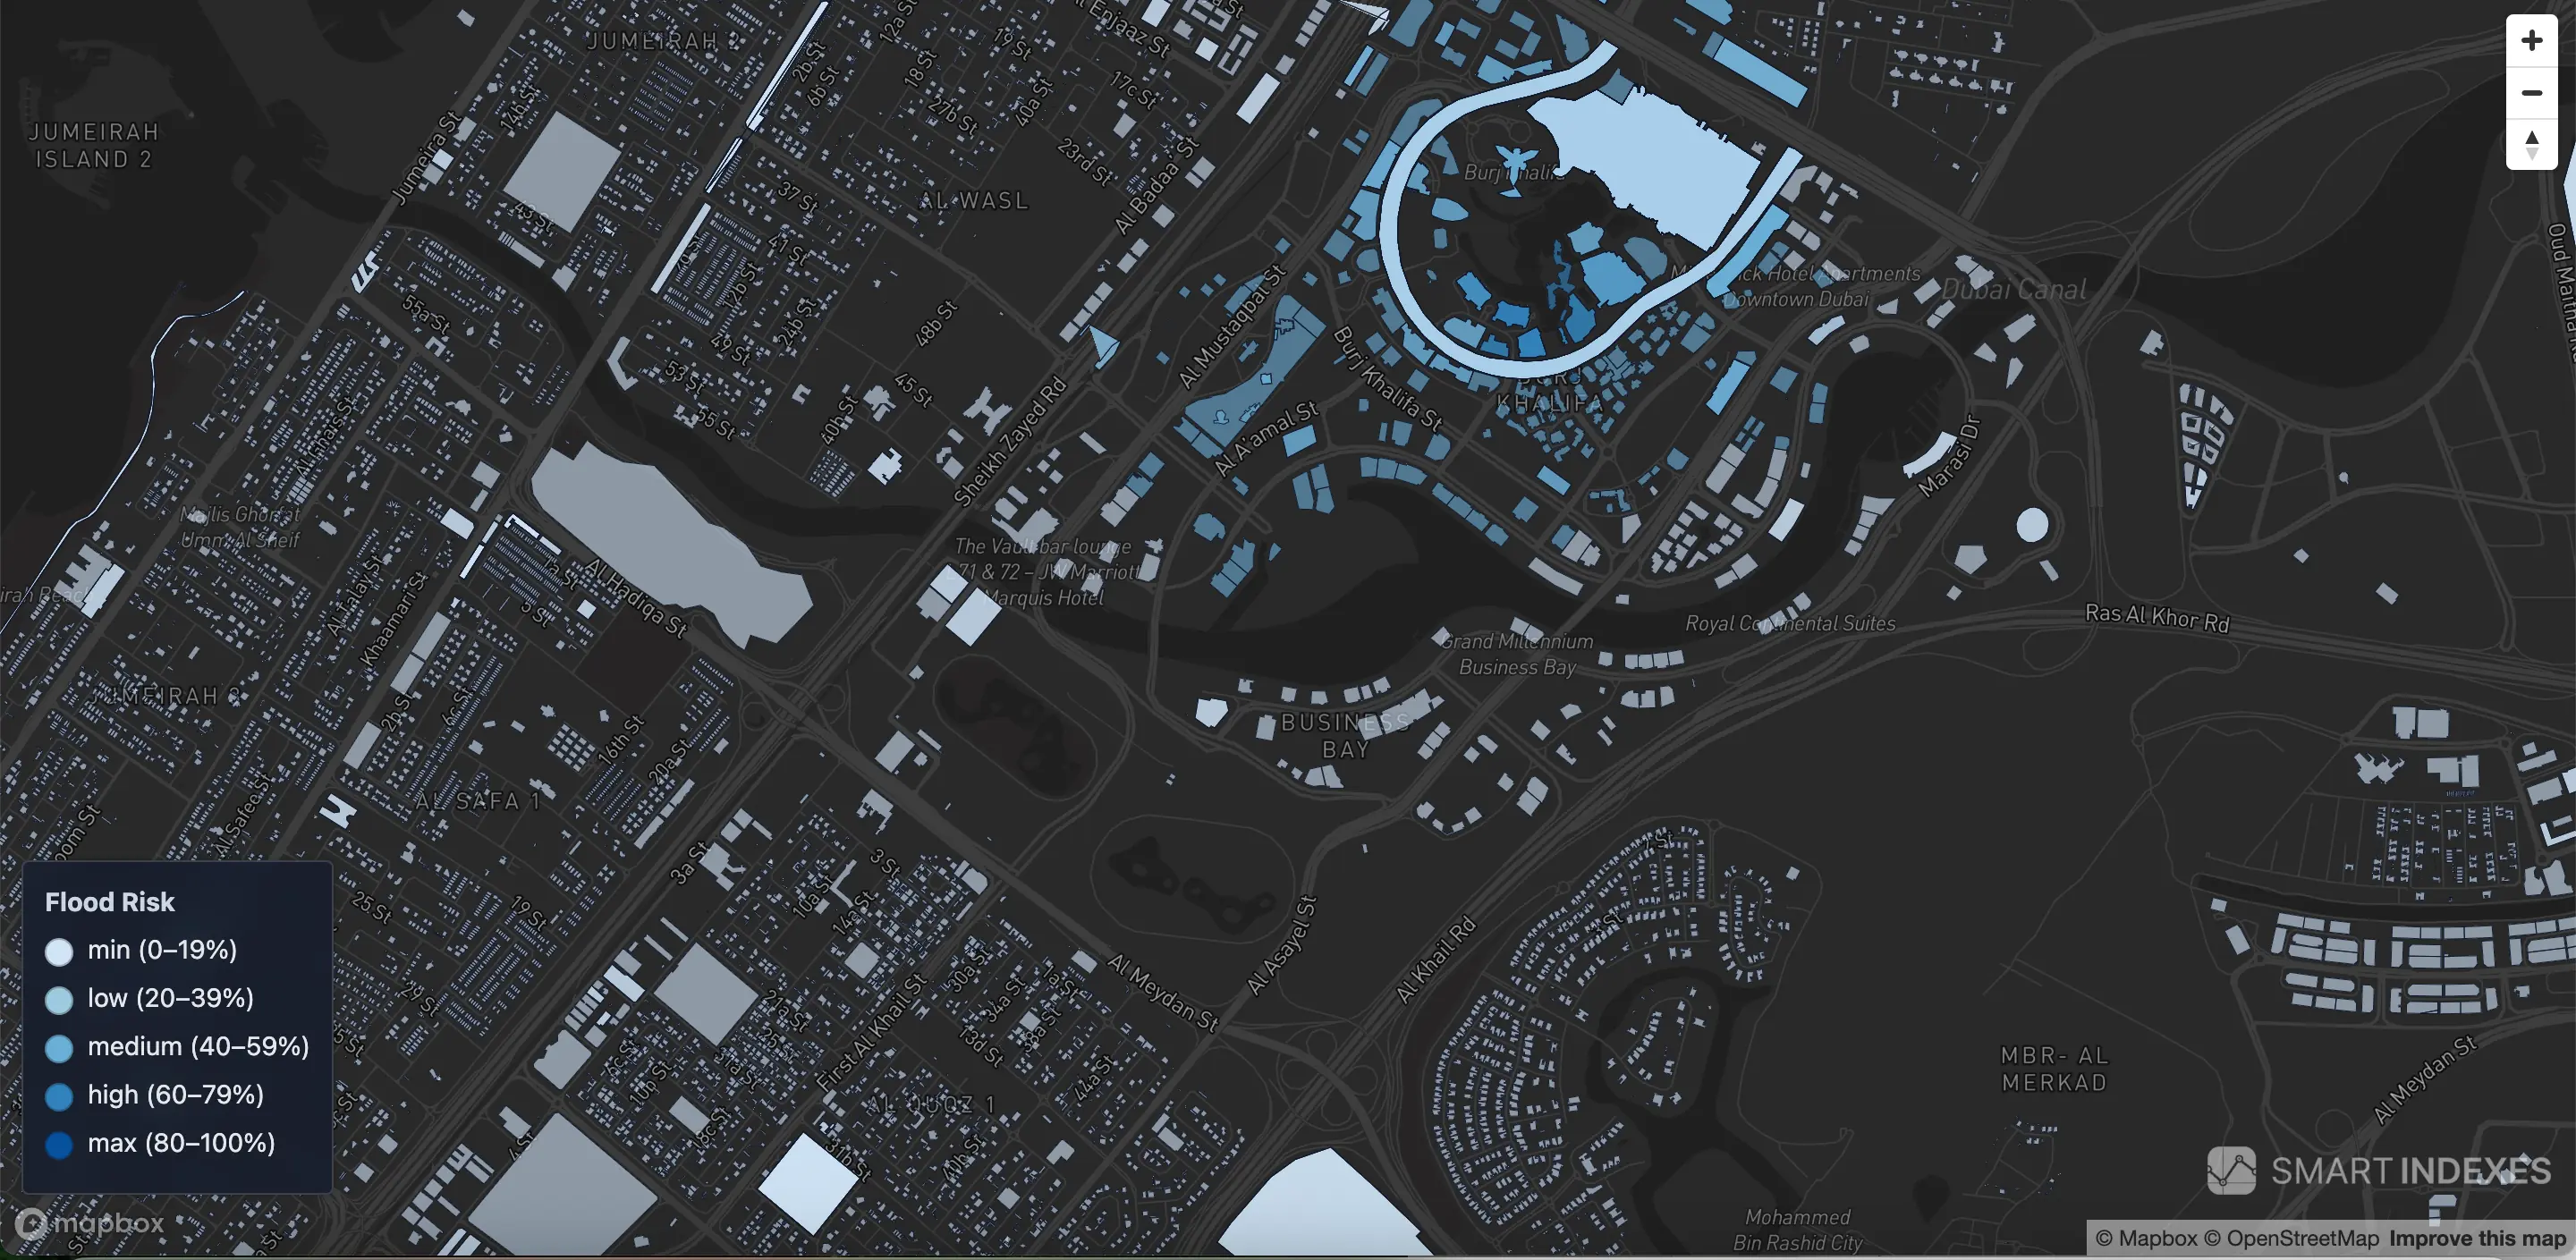 Color segmentation of flood risk for buildings in Dubai based on counted flooded area in radius 1 km from building entrance (Makani Number)
{
                    "type": "Feature",
                    "id": "1002569785_pt_55.1171067845551_25.0317577282823",
                    "geometry": {
                        "type": "Point",
                        "coordinates": [55.1171067845551,25.0317577282823]
                    },
                    "properties": {
                        "makani_number": "1002569785",
                        "parcel_id": 5910297,
                        "bldif": 56568,
                        "building_name": "",
                        "address": "JABAL ALI FIRST - 591",
                        "community": "JABAL ALI FIRST",
                        "flood_analysis": {
                        "total_flood_risk": 7.79,
                        "flood_risk_level": "min",
                        "flood_risk_fill_color": "#d0e4f7",
                        "flood_area_nearby_km": 0.14,
                        "flooded_zones": 14
                        },
                        "property_id": null,
                        "area_id": null,
                        "zone_id": null,
                        "land_number": null,
                        "land_sub_number": null,
                        "munc_zip_code": null,
                        "munc_number": null,
                        "separated_from": null,
                        "separated_reference": null,
                        "project_id": null,
                        "master_project_id": null,
                        "property_type_id": null,
                        "property_sub_type_id": null,
                        "land_type_id": null,
                        "is_free_hold": null,
                        "is_registered": null,
                        "is_commonhold": null,
                        "is_usufruct": null,
                        "is_musataha": null,
                        "is_leasehold": null,
                        "is_subdivided": null,
                        "actual_area": null,
                        "land_actual_area": null,
                        "building_actual_area": null,
                        "area_name_ar": "",
                        "area_name_en": "",
                        "land_type_en": "",
                        "property_sub_type_en": "",
                        "project_name_ar": "",
                        "project_name_en": "",
                        "master_project_en": "",
                        "master_project_ar": "",
                        "property_type_ar": "",
                        "property_type_en": "",
                        "property_sub_type_ar": "",
                        "fill": "",
                        "stroke": "",
                        "ownership_key": ""
                    }
                    }
Flood risk calculation methodology
for Dubai communities
1. Data sources
To empirically calculate flood risk, used Google Earth satellite imagery from April 2024, which captured extreme rainfall events in the Emirate of Dubai.
2. Calculation methodology
2.1. Flooded area percentage
Calculated as the ratio of the total flooded area within a community to its total area:
areaPct = (Sum of flood zone areas / Community area) × 100 %
Where:
Sum of flood zone areas— the cumulative area of all flood zones.Community area— the area of the community polygon within its administrative boundaries.
2.2. Zone‑count ranking
A large number of discrete flood zones, even if each is small, indicates significant fragmentation of flooded areas. To account for this, we apply the following thresholds:
| Count of zones | Risk band | Implied risk % |
|---|---|---|
| 0 – 30 | min | 0 % |
| 31 – 60 | low | 20 % |
| 61 – 90 | medium | 40 % |
| 91 – 120 | high | 60 % |
| > 120 | max | 80 % |
Clarifications for the table:
-
Minimum flood risk — these areas are generally situated on higher ground or slopes, which facilitate natural runoff of rainwater. As a result, flood zones rarely form in such locations.
These locations may be considered more favorable for development or investment due to their minimal flood risk.
-
Low flood risk — these areas have a limited and stable number of small flood zones, typically due to minor elevation differences. Flooding is localized and generally does not significantly impact land use.
-
Medium flood risk — these areas require attention from planners and engineers to enhance the rainwater drainage system and reduce water accumulation.
-
High flood risk — these areas also require priority improvements to drainage systems. Any new developments here should incorporate appropriate water management measures at the planning stage.
-
Maximum flood risk — these areas have the highest likelihood of flood-related impacts on assets such as storage facilities, parking areas, and properties. Priority measures for improving drainage should be developed based on documented flood zone data.
2.3. Final risk percentage
For each community, compute two values:
areaPct— the flooded area percentage.zoneBasedPct— the percentage implied by the zone‑count ranking (0, 20, 40, 60, or 80 %).
floodRiskPct = max(areaPct, zoneBasedPct)
2.4. Classification & coloring
The final floodRiskPct is classified into five levels and color‑coded:
- min (0 – 19 %)
- low (20 – 39 %)
- medium (40 – 59 %)
- high (60 – 79 %)
- max (80 – 100 %)
Visualization of methodology for master projects
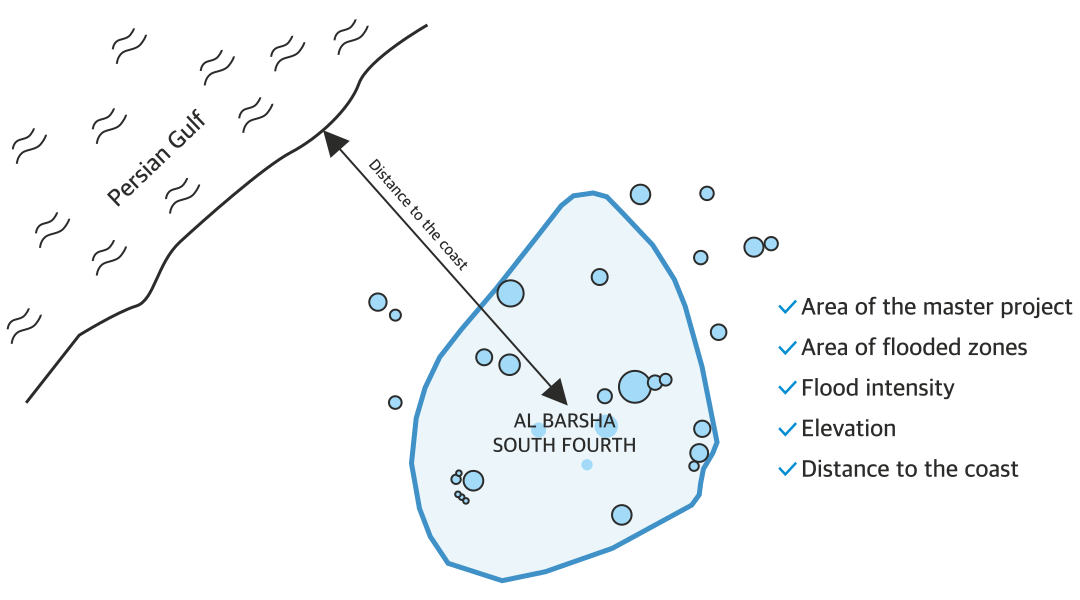
About methodology
- Data collection:
- Master project polygons (development boundaries).
- Relief characteristics: average or minimum elevation (E).
- Distance from polygon centroid to the coast (D).
- Geometry and intensity of actual flood zones (I).
- Parameter calculation:
A— Master project area in km².F— Flooded area within the project in km².I— Flood intensity: ratio of flood‑point count (or density) within the polygon to the maximum observed.E— Elevation: average or minimum height above sea level.D— Distance to the coast: from the polygon centroid to the nearest coast point.
Result
The overall flood risk index P (%) is calculated as a weighted combination of the main factors:
P = wA·A + wF·F + wI·I + wE·E + wD·D
Here, w• are the selected weights balancing each parameter’s contribution to the final risk.
Summary:
This simplified multi‑factor flood risk index for master projects accounts not only for the flooded area but also for critical characteristics such as relief, proximity to the coast, and flood‑zone intensity.
Visualization of flood risk on map
Flood zones by round colored segmentation available by select option on geoanalytical map by Smart Indexes.
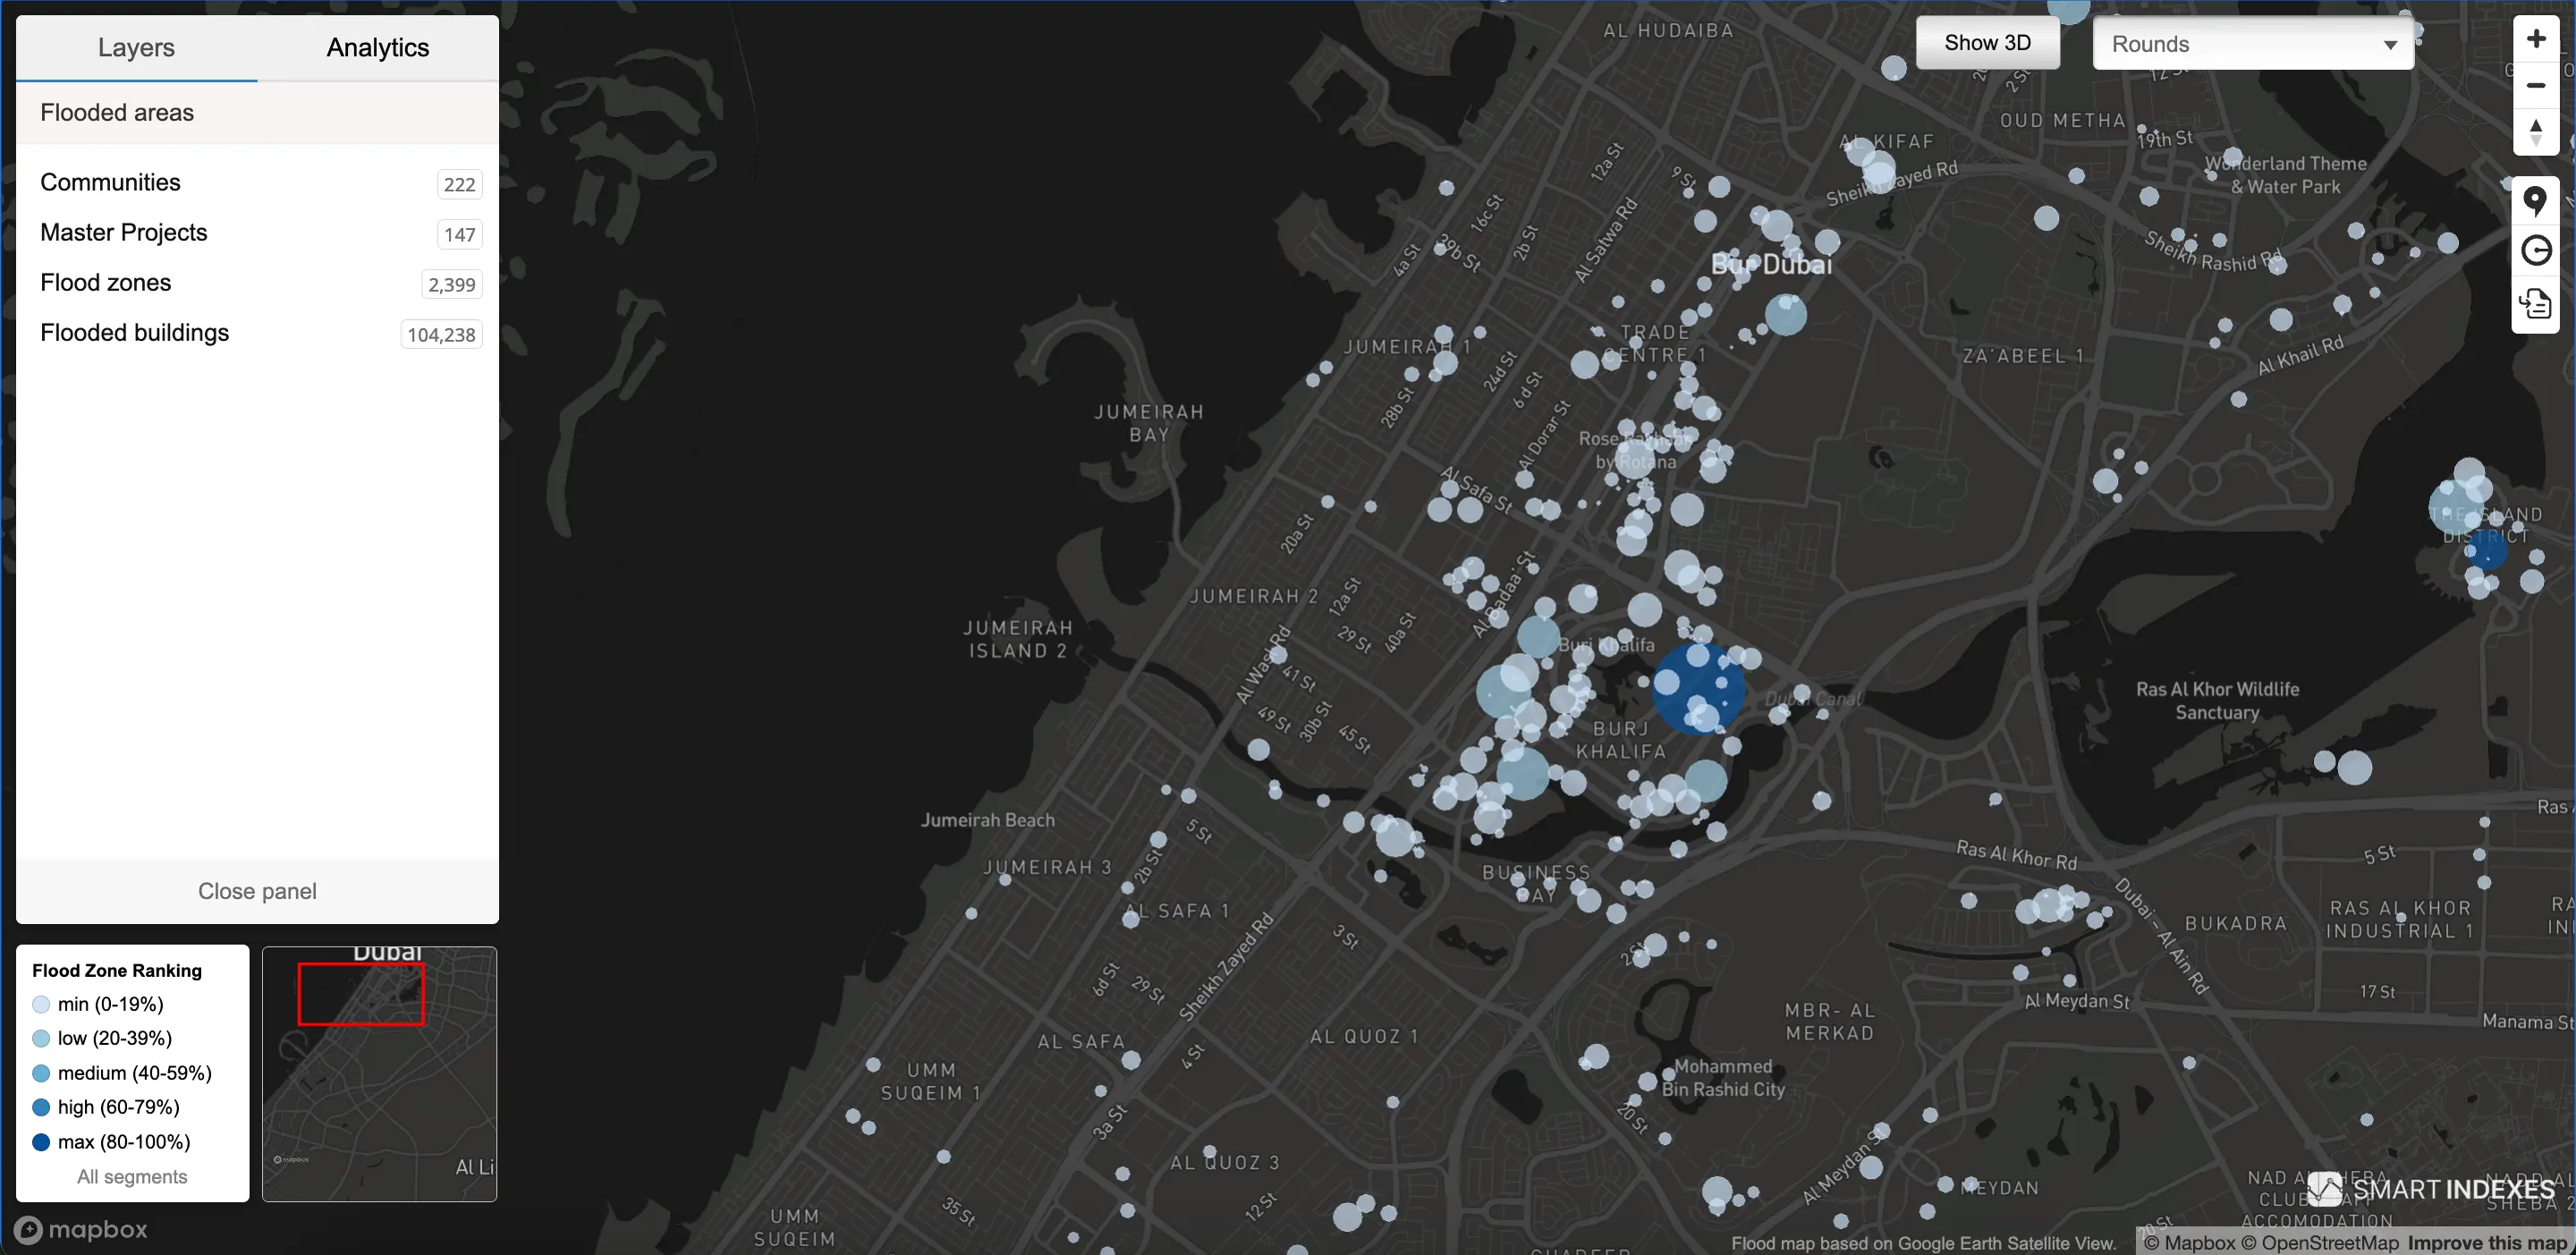 Flood zones by round segmentation on geoanalytical map by Smart Indexes.
Complex heatmap available too in segmentation view by top select option.
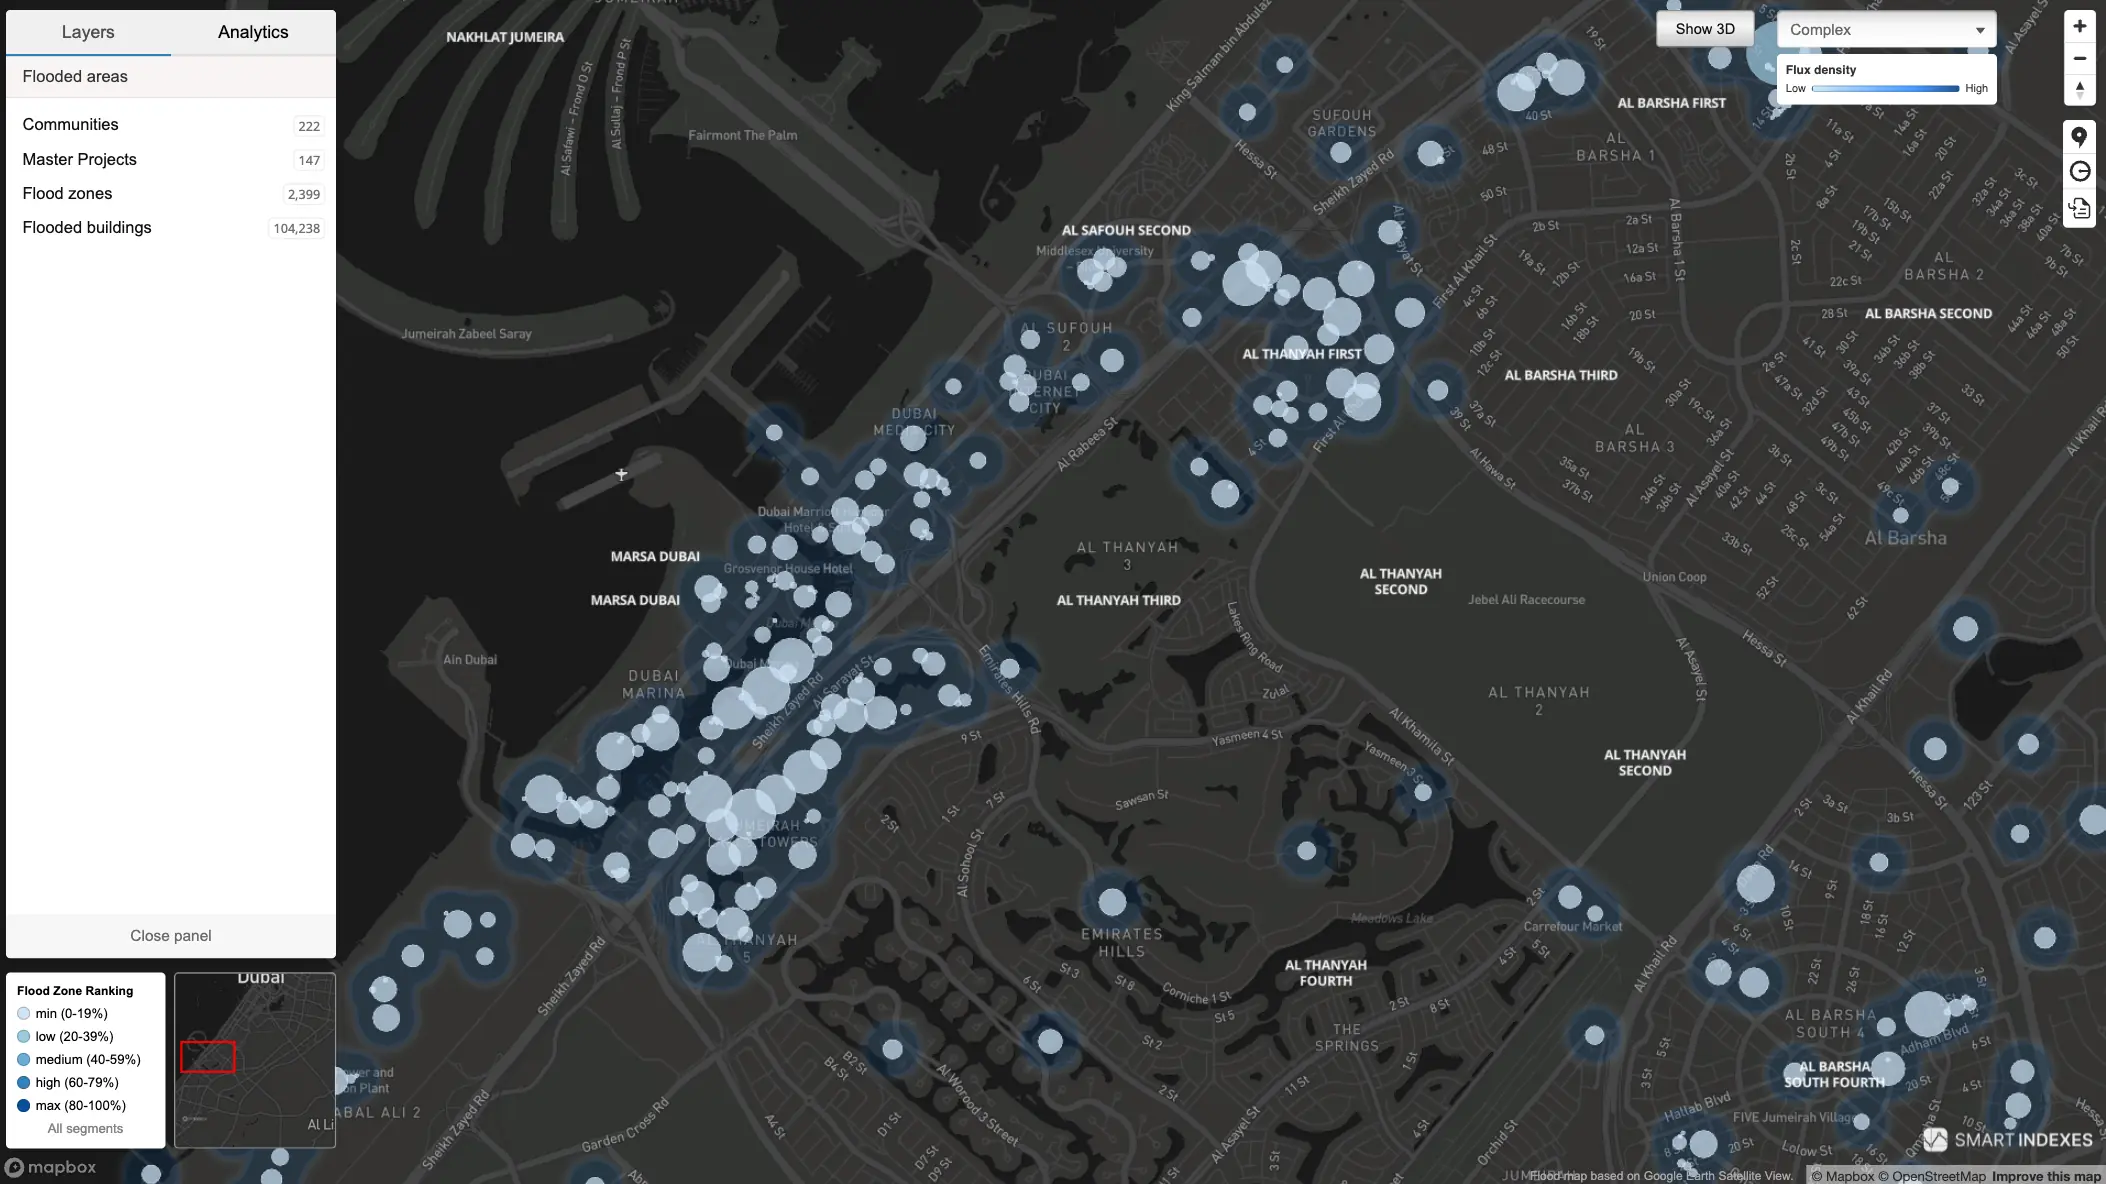 Flood zones by complex heatmap segmentation on geoanalytical map.
Top view in 3D mode on map of flood zones presented on screenshot bottom next.
.webp) Geoanalytical map of Smart Indexes “Flood Risk Analysis” — close-up of the Burj Khalifa area.
Geoanalytical map of Smart Indexes “Flood Risk Analysis” — close-up of the Burj Khalifa area.
Accuracy of coordinates for flood zones of the Emirate of Dubai
The original dataset of digitizing flood zones from satellite:
- Latitude:
54.950840705404886 - Longitude:
24.923109219276284
It presents the coordinates of flood zones with 15 decimal places (places after the decimal point), which corresponds to very high accuracy.
In the output of the Flood Zones Summary case on the map for operational display without losses - the coordinates have 6 decimal places, which gives an approximate accuracy of up to ~11 cm:
- Latitude:
55.369244 - Longitude:
24.965521
Instruments of geo analytical map
The current geospatial analysis tools for the flood‑zone map are presented below for user exploration. This tools are useful to monitoring of flooded zones on streets and nearby territories of buildings in Dubai.
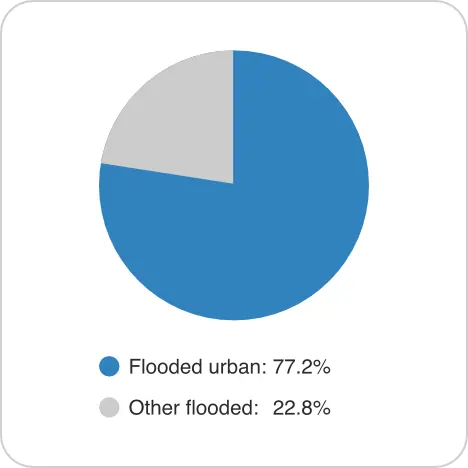
In section Analytics «Ratio of flooded areas»: the diagram shows the percentage distribution of flooded areas: urban zones (77.2%) and other regions (22.8%), with a clear layout that enables quick analysis of flood‑damaged territories.
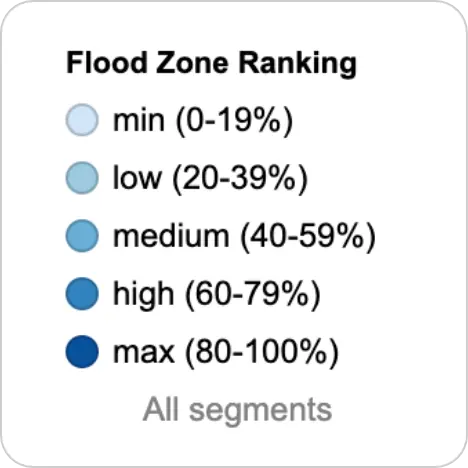
In legend of geo analytical map: community areas color‑segmented on the map by flood‑zone rankings in percentage bands. Useful to segmentation the territories by its administrative borders and flood risk level.
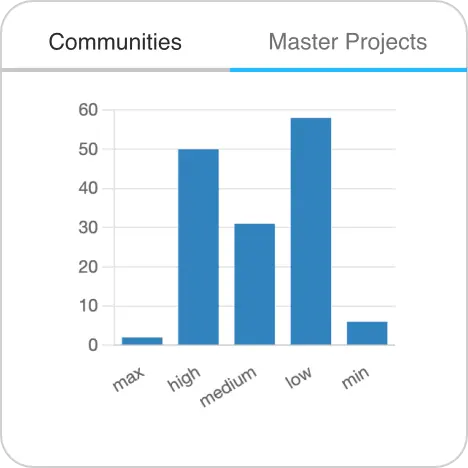
Segmentation by flood risk: this histogram shows percentage‑level flood‑risk categories for communities and master‑plan projects, based on meteorological data from April 2024. Levels range from minimum to maximum, covering both standard and actual flood‑risk segments.
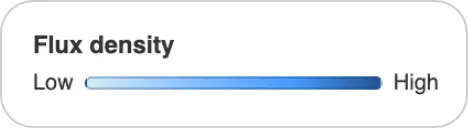
Map Segmentation: when Complex Heatmap is selected, a flux‑density chart appears below, showing the detailed color segmentation of flood zones on the Dubai map.
Usage in GeoAnalytics
Flood risk overlays are available under Property > Summary > Risks on the Dubai map.
Evaluating flood risk is crucial for balancing potential returns against exposure to extreme weather events.