Traffic Accident Rate
Published on
Overview
The Traffic Accident Rate (TAR) metric is derived from publicly available road-traffic accident data in Dubai, sourced from Dubai Pulse.
It highlights accident "hot spots" where collisions frequently occur, helping users identify potentially hazardous road segments.
The TAR index enables spatial mapping of traffic accidents across communities and master projects. This allows for ranking locations by accident risk and supports more informed real estate decision-making.
It raises awareness among buyers, developers, and stakeholders by providing insight into the actual traffic situation on the ground, based on verified official data.
Formula of TAR
For counting risk-index TAR used next formula:
TAR = Number of traffic incidents / Area (km² or boundary) / Time period
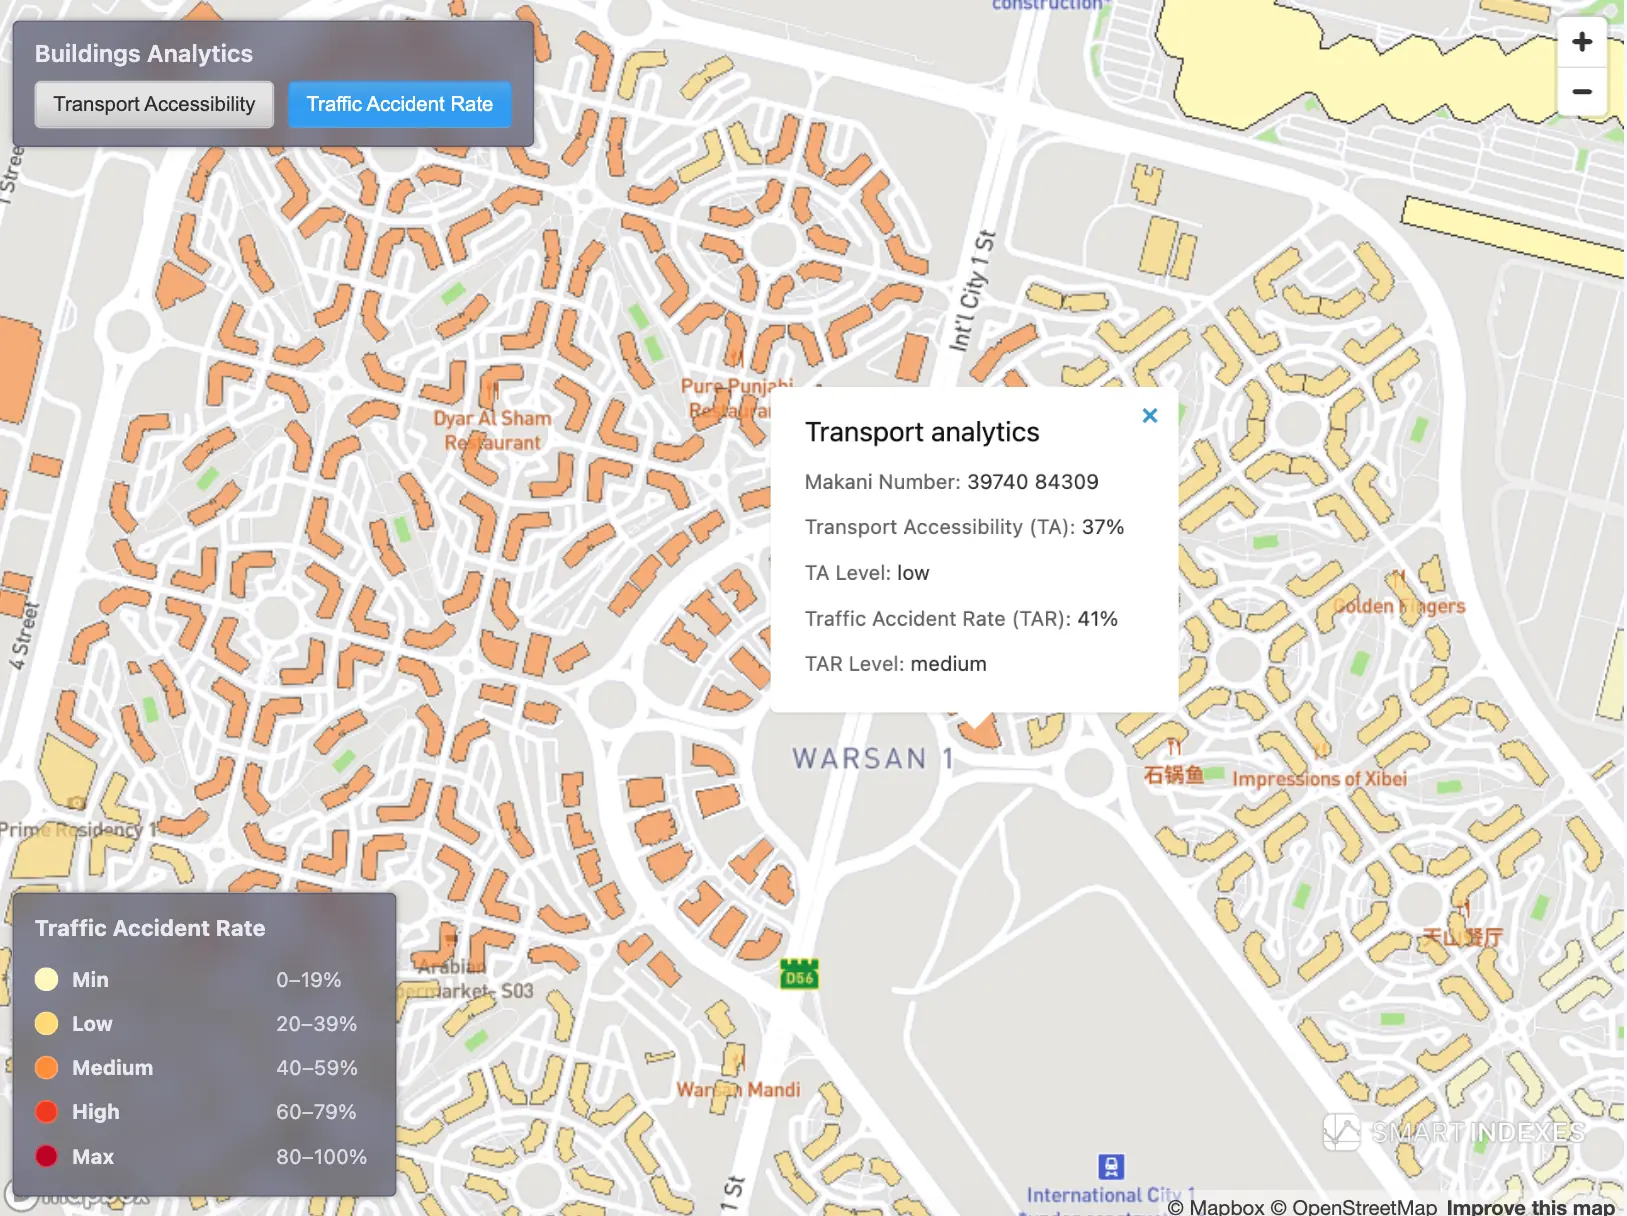 Medium level of Traffic Accident Rate on Dubai's map
Geoanalytical map of Dubai's communities
Color segmentation of Dubai's communities for common data: population. density (plp/km2), Average Crime Rate and Traffic Accident Rate are available on geoanalytical map.
Read more in description of showcase Geoanalysis of communities for risk management.
Using the TAR risk index
For solving applied risk management problems, the TAR risk index is applicable to the following areas:
-
For logistics
Understanding TAR is necessary for planning logistics and delivery routes taking into account safety and efficiency, as well as for balancing travel time with the risk of accidents. -
For investors
Balanced selection of real estate taking into account the risk of an accident within a radius of 1 km from the building of interest. -
For development
Choosing a safe location for the construction of a residential and/or commercial complex. -
For IT in the segment proptech
Training an AI agent (neural network) on traffic accident and TAR data to help real estate agents and buyers, renters. -
For insurance companies
Geoanalytical transparent assessment of the probable risk of road accidents for logistics routes of retail companies with the expansion of branch coverage and infrastructure in the Emirate of Dubai.
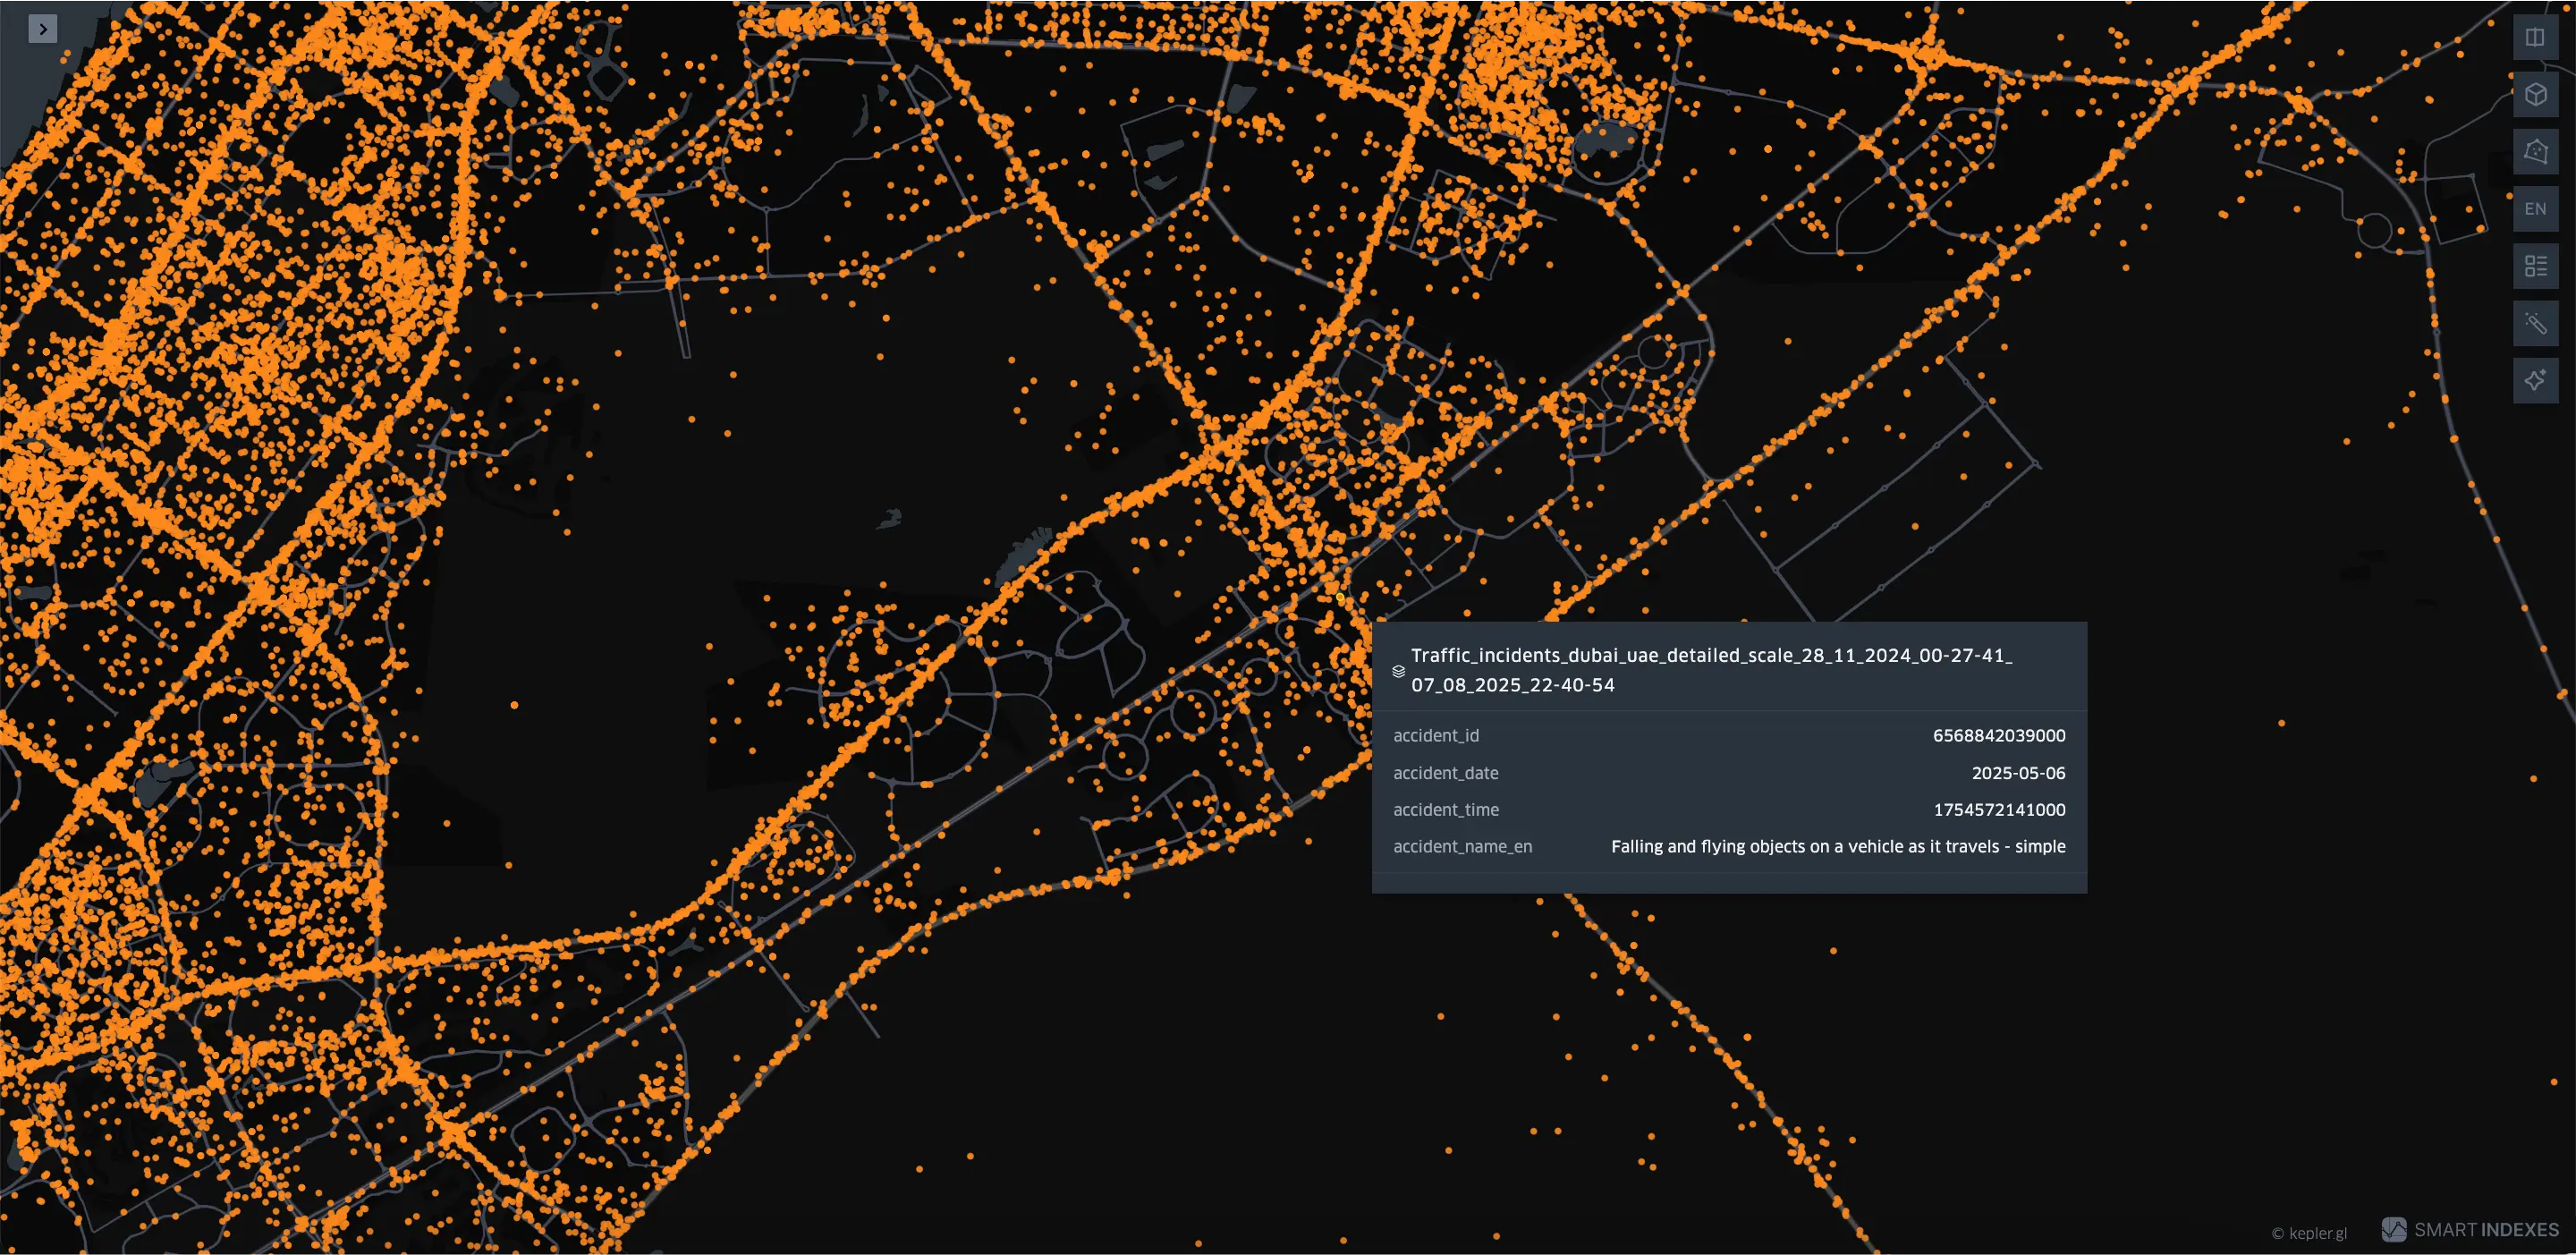 Detailed scale of Dubai's map by traffic incidents from 28.11.2024 (00:27:41) to 07.08.2025 (22:40:54)
Big data of traffic accidents based on open data from Dubai Land Department (Dubai Pulse).
Example of source data «Traffic incidents»
| acci_id | acci_time | acci_name | acci_x | acci_y |
|---|---|---|---|---|
| 6901274801 | 07/08/2025 22:40:54 | مركبات مخالفة | 25.28178704 | 55.33596121 |
| 6901285040 | 07/08/2025 22:43:53 | وجود جسم في الشارع - بسيط | 25.23670259 | 55.37788565 |
| 6901307162 | 07/08/2025 22:51:20 | صدم جدار - بسيط | 25.04286383 | 55.11934383 |
| ... | ... | ... | ... | ... |
Accuracy of the original data
Coordinates of traffic incidents (e.g., [55.33596121, 25.28178704]) are provided with 8 decimal places, which in geographic coordinates corresponds to a theoretical precision of approximately 1 cm.
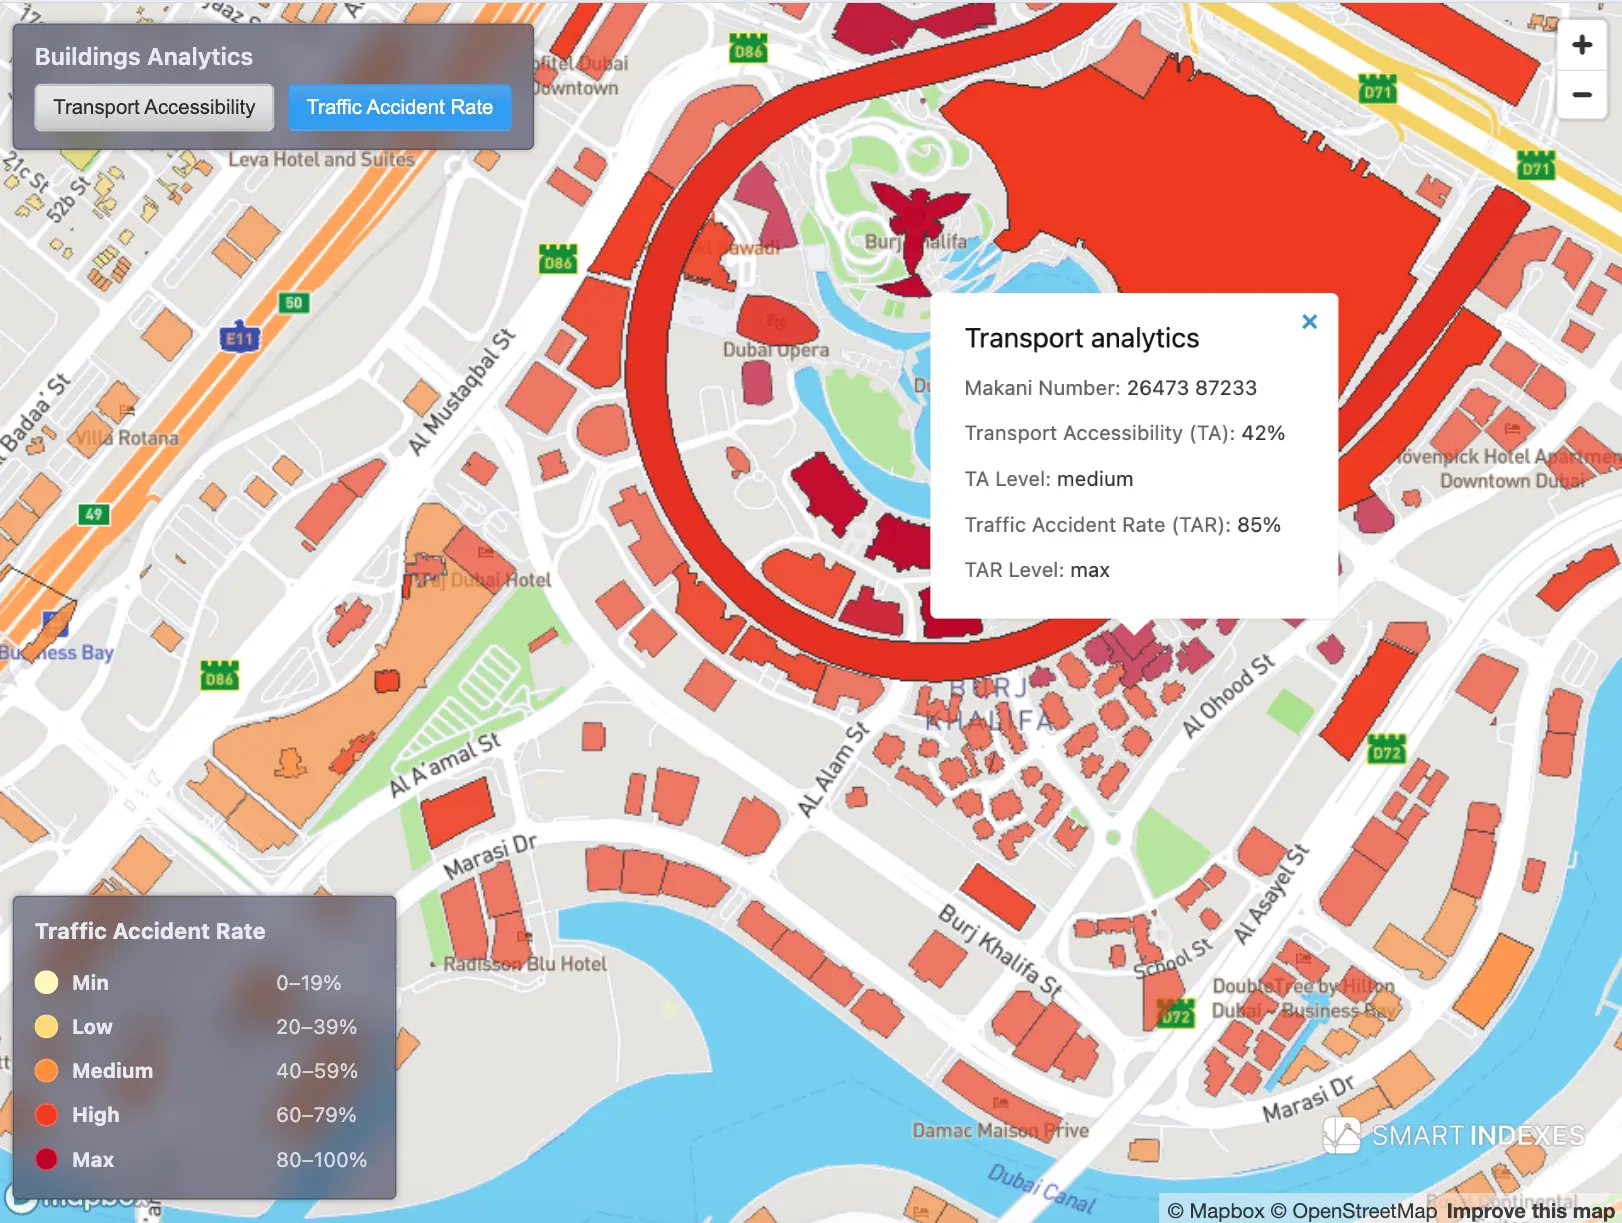 Traffic Accident Rate on Dubai's map based on Makani Number and registered nearby traffic incidents
Definition
TAR is calculated as the number of reported accidents per area or road segment over a defined period, normalized to allow comparison across districts. Higher TAR values indicate greater collision risk.
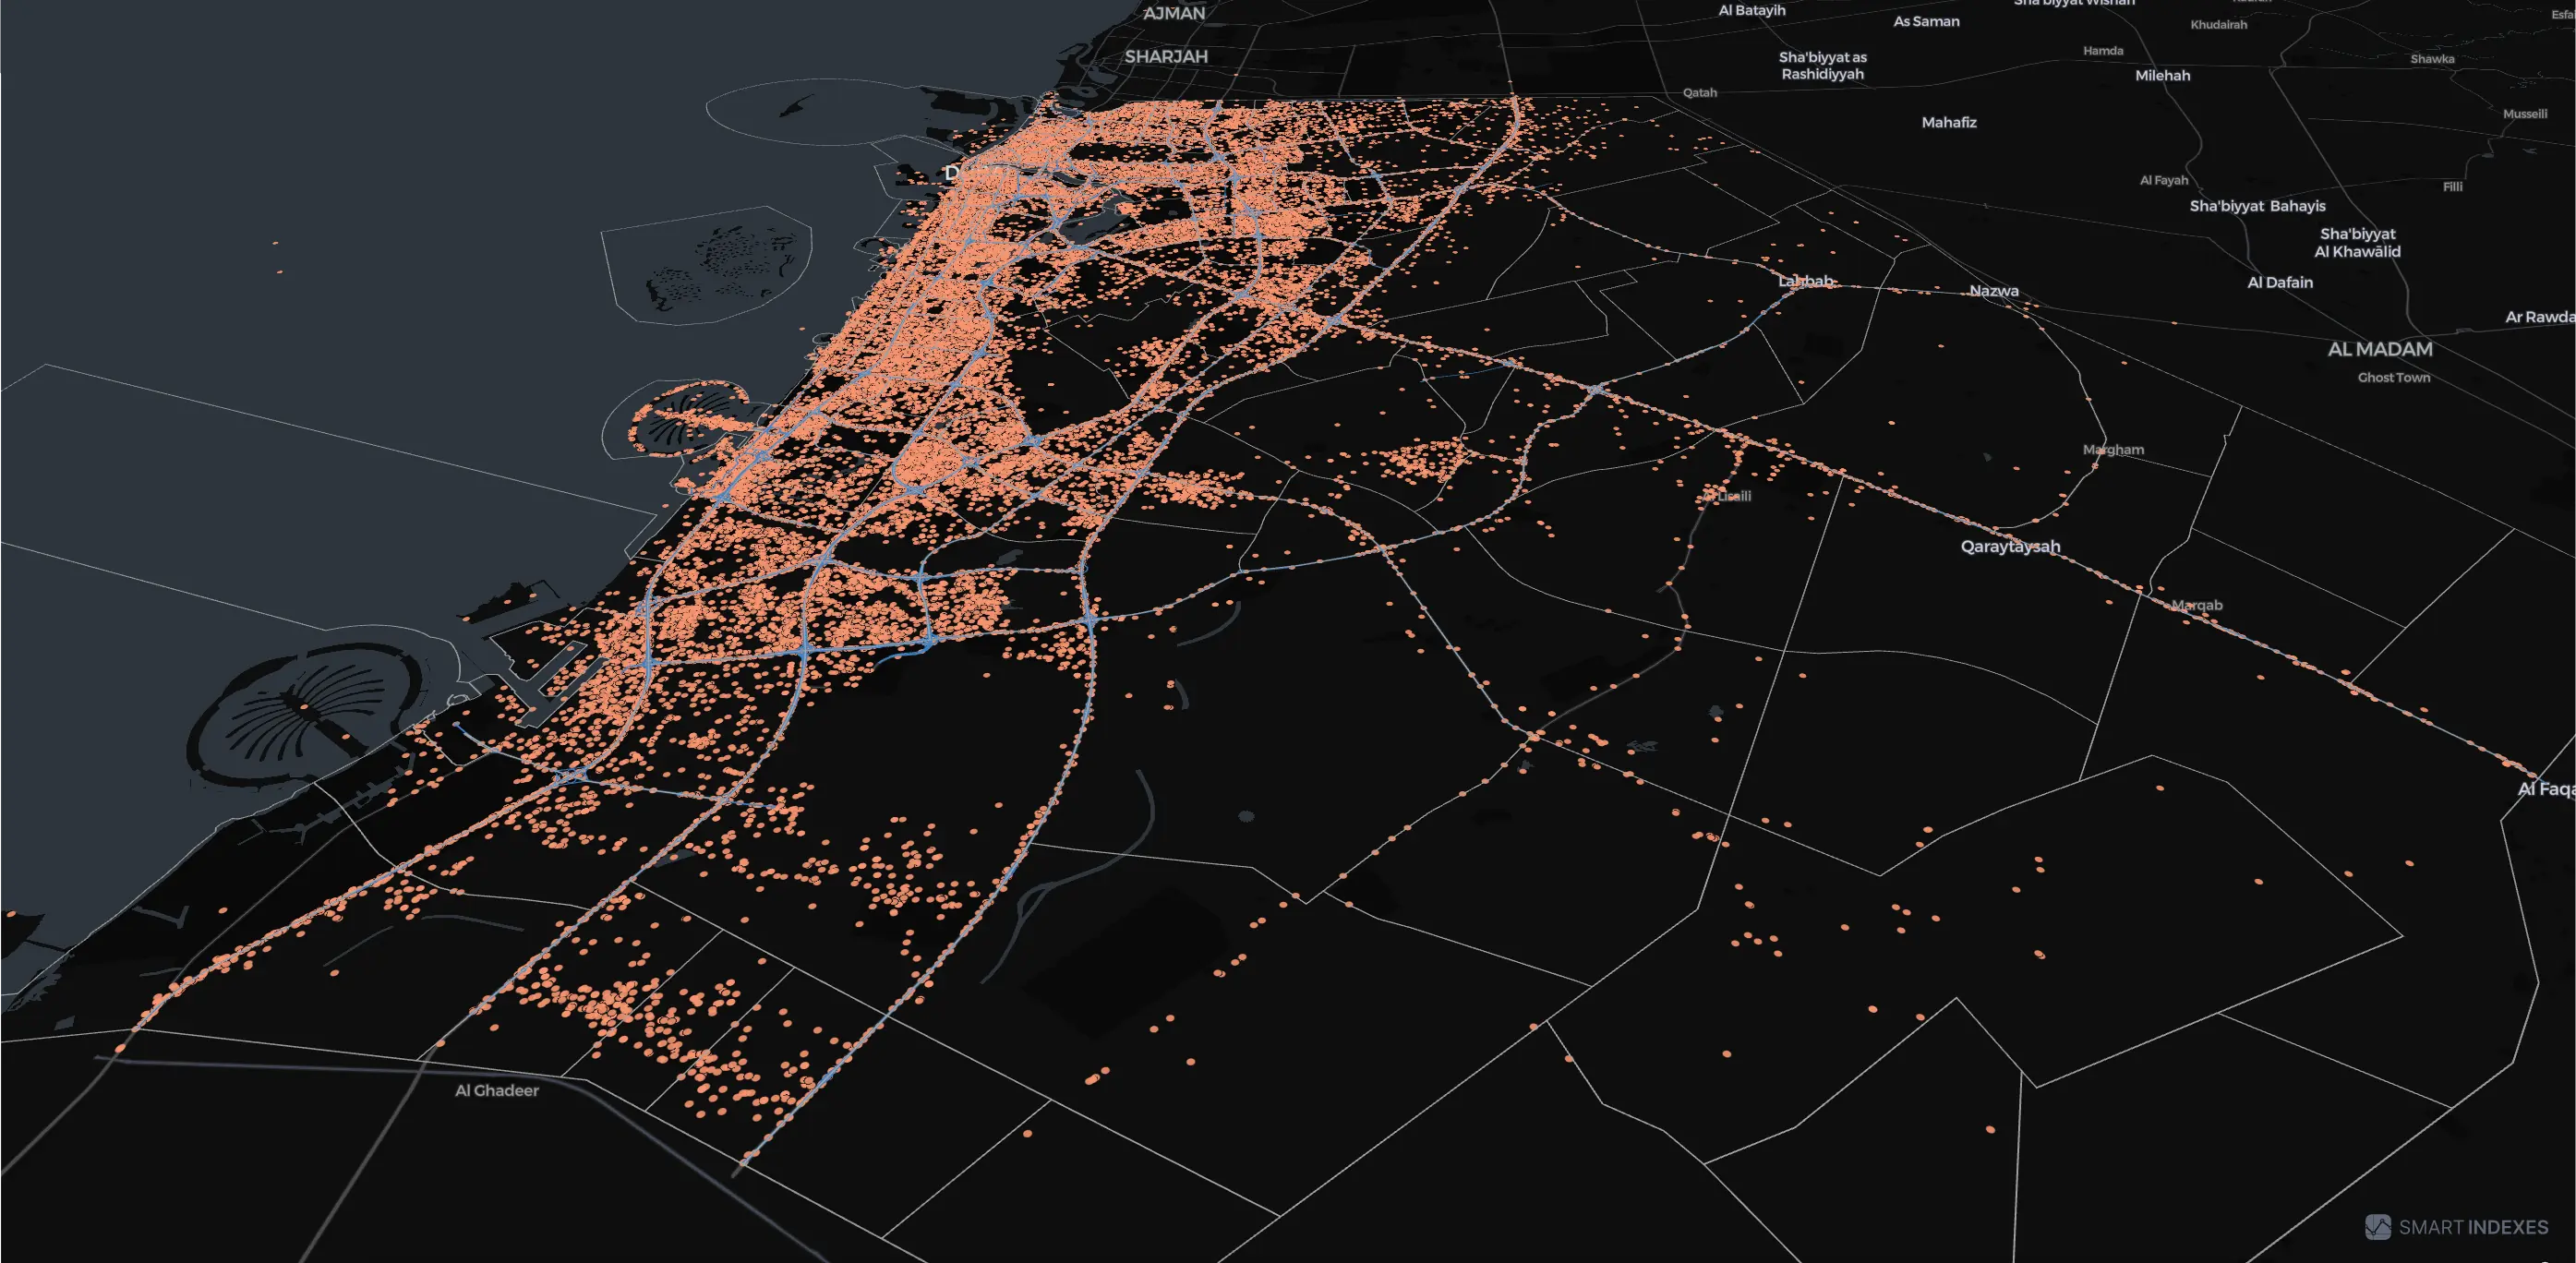 Isometric night view on layers: communities borders, roads, traffic incidents on map of Dubai
TAR (Traffic Accident Risk): Methodology
In practice TAR is computed using different spatial approaches depending on the geo-object type. The goal is to reflect the actual traffic accident exposure near each asset.
Object Types
- Communities
- Master development projects
- Buildings (also residential and commercial projects of development)
{
                    "type": "FeatureCollection",
                    "features": [
                        {
                        "type": "Feature",
                        "geometry": {
                            "type": "Polygon",
                            "coordinates": [
                            [
                                [55.11561402,25.114975788],
                                [55.115612719,25.114970992],
                                [55.115592098,25.11497562],
                                [55.115573106,25.114905441],
                                [55.115593727,25.114900813],
                                [55.115590841,25.114890148],
                                [55.115609191,25.11488632],
                                [55.11559414,25.114830437],
                                [55.11557685,25.114834537],
                                [55.115573108,25.114820359],
                                [55.115552546,25.114824851],
                                [55.115537004,25.114765961],
                                [55.115557566,25.114761469],
                                [55.115552425,25.114742017],
                                [55.115548948,25.11472885],
                                [55.115618381,25.114713677],
                                [55.115613056,25.114696825],
                                [55.115647306,25.114689382],
                                [55.115659307,25.114659276],
                                [55.115621009,25.114646202],
                                [55.115634484,25.114612315],
                                [55.115675915,25.114625854],
                                [55.115730049,25.114643537],
                                [55.115725437,25.114655961],
                                [55.115716909,25.11467895],
                                [55.115718766,25.114688097],
                                [55.115759385,25.114678895],
                                [55.115778221,25.114752847],
                                [55.115694766,25.114770048],
                                [55.115704458,25.114806496],
                                [55.115680463,25.114812058],
                                [55.115681982,25.114816637],
                                [55.115702395,25.114812063],
                                [55.115714748,25.114857732],
                                [55.115693402,25.114862521],
                                [55.115695463,25.11486888],
                                [55.11570889,25.11486769],
                                [55.11572607,25.114880552],
                                [55.115726782,25.114887152],
                                [55.115739757,25.114883813],
                                [55.115736459,25.114870826],
                                [55.115784,25.114860298],
                                [55.115787614,25.114874567],
                                [55.115804178,25.114871088],
                                [55.115815895,25.114917388],
                                [55.115799331,25.114920867],
                                [55.115802678,25.114934079],
                                [55.115760225,25.114943522],
                                [55.115762323,25.114951298],
                                [55.11571015,25.114962686],
                                [55.115707694,25.114955153],
                                [55.11561402,25.114975788]
                            ]
                            ]
                        },
                        "properties": {
                            "makani_number": "1001178986",
                            "transport_accessibility_score": 31,
                            "transport_accessibility_score_level": "low",
                            "transport_accessibility_score_fill_color": "#c2e699",
                            "traffic_accident_rate": 1.4,
                            "traffic_accident_rate_level": "min",
                            "traffic_accident_rate_fill_color": "#fff7bc",
                            "registered_traffic_incidents": [
                            {
                                "start_date": "2024-11-27",
                                "start_time": "21-27-41",
                                "end_date": "2025-08-07",
                                "end_time": "20-25-08",
                                "quantity": 22
                            }
                            ]
                        }
                        }
                    ]
                    }
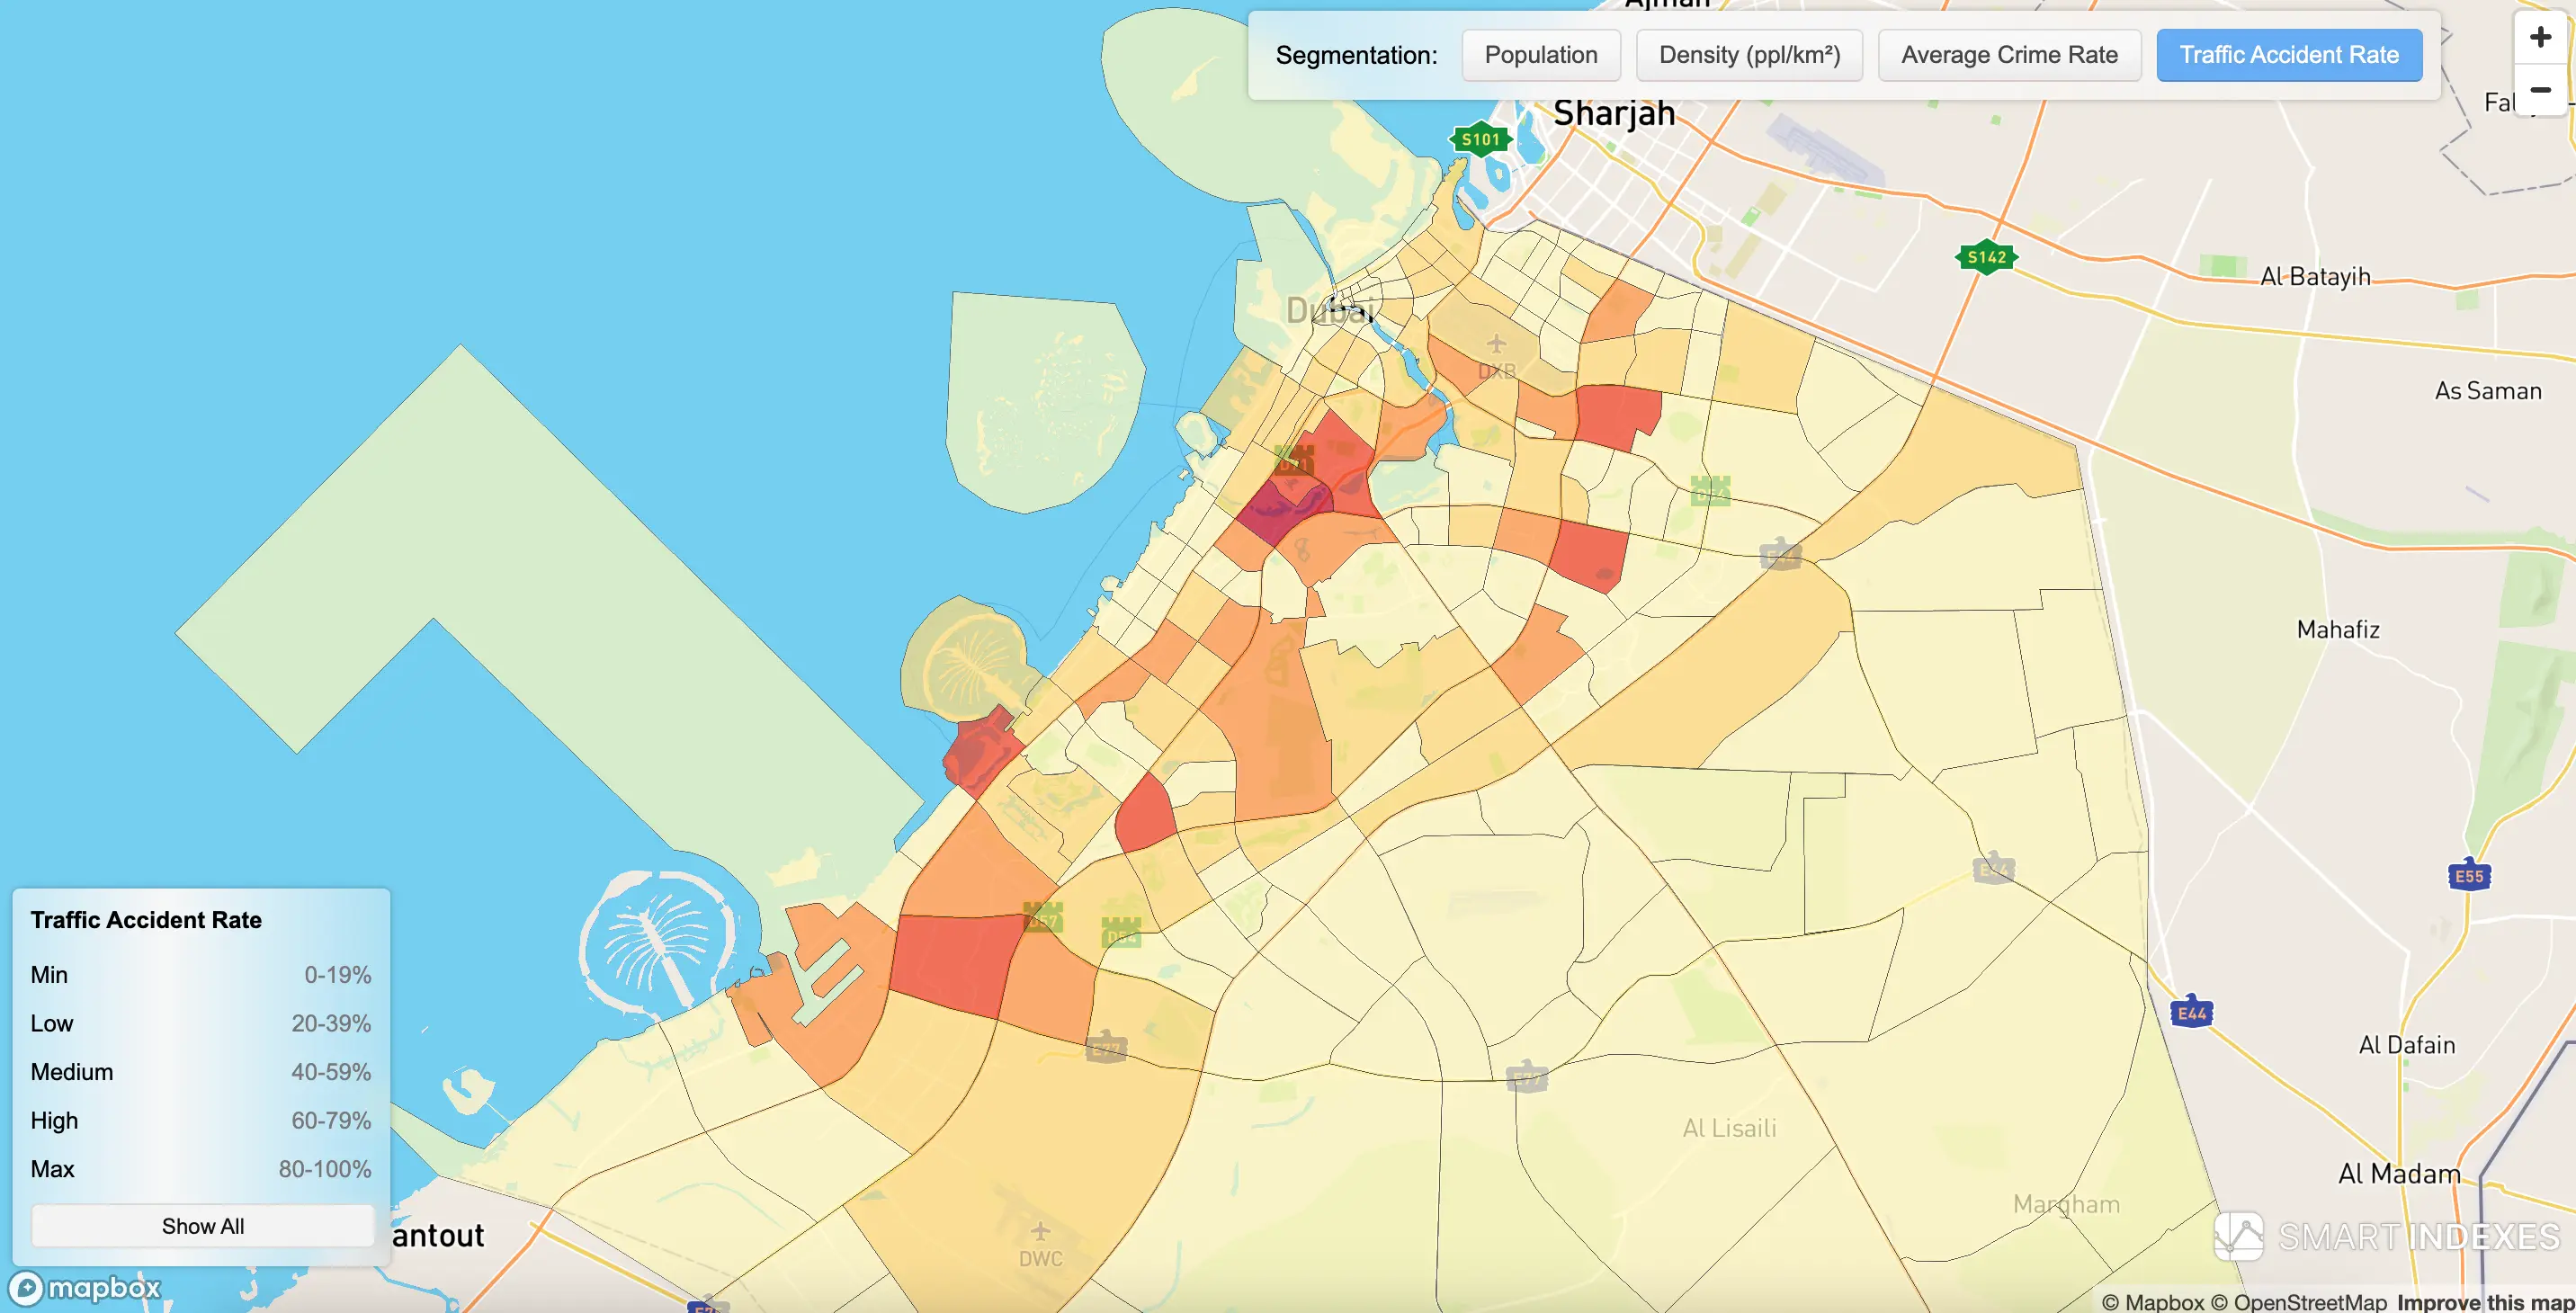 Traffic Accident Rate for communities using color segmentation on map of Dubai
On image of TAR for communities using color segmentation on map of Dubai: Business Bay, Dubai Marina, Burj Khalifa have the high and max levels of risk-factor TAR, based on statistics of traffic incidents.
Computation by Object
Counting TAR for communities & master projects
TAR is calculated by counting incidents whose coordinates fall within the polygon boundary of the respective area for the selected period (e.g., month, quarter, or year).
Counting TAR for buildings
TAR is calculated by counting incidents within a 1 km radius around the building centroid. This captures the practical risk of encountering an accident when traveling in any direction along Dubai’s road network from the asset’s location.
Why this matters
Even for assets with comparable capitalization rates, spatial diffusion of incidents can lead to different TAR values: within the same 1 km buffer around two building centroids, the observed incident counts (per Big Data, Dubai Pulse) may differ.
This approach helps investors find assets with a higher capitalization rate and a lower TAR, achieving a better balance between price and risk.
This makes TAR a practical layer in GeoAnalytics tools for optimizing safety, investment decisions, and urban planning.
Usage in GeoAnalytics
Traffic accident rate overlays are available under Property > Summary > Risks on the Dubai map.
Use the TAR layer to choose routes and locations that minimize accident exposure while optimizing operational efficiency.