Analytics of real estate
Published on
The wide range of the common economical, social, geo metrics and property price indexes in product GeoAnalytics targeting the optimal choice of location to buy or rent of property to use in chosen strategy of investment.
The purpose of Smart Indexes analytics
Weighing the risks against the price per square meter of residential and commercial real estate in each of Dubai's communities.
The Smart Indexes API contains derivative indices that assess real-time risks for real estate investments in emerging Dubai areas based on price per sq. m based on open public government and commercial sources.
Analytics of the Dubai real estate market
In the financial market, real estate market analytics based on verified data plays a key role in forecasting and planning investment decisions.
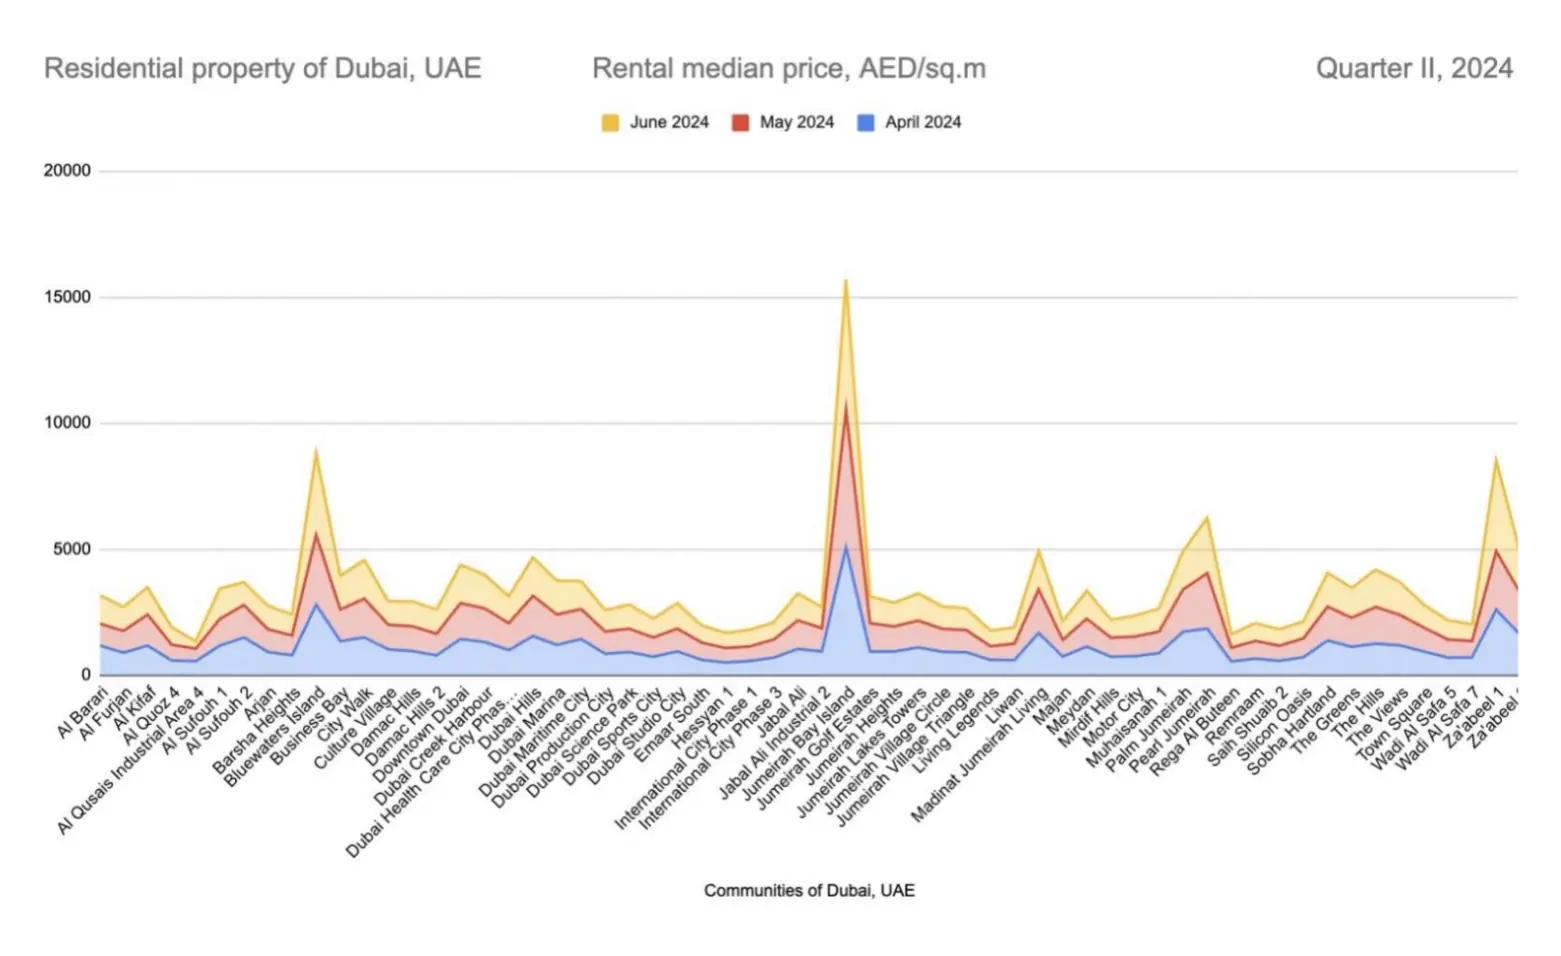 Median rental price, AED/sqm in Quarter II, 2024 for residential property in Dubai, UAE
Such analytics are essential for informed long-term planning. Based on Smart Indexes analytics, investors can consider possible risks that may affect property values in the future and adapt their strategies to changing conditions. This ensures flexibility and preparedness for market fluctuations, especially in the context of instability or growth in certain areas.
In addition, the indices serve as a basis for developing analytical and consulting services that can offer clients detailed reports on Dubai’s communities, master projects and buildings. These reports contain important metrics such as price/risk ratios, capitalization rates and other indicators, which allows for more informed investment decisions. Such services are in demand among both private investors and corporate clients interested in accurately assessing and managing risks.
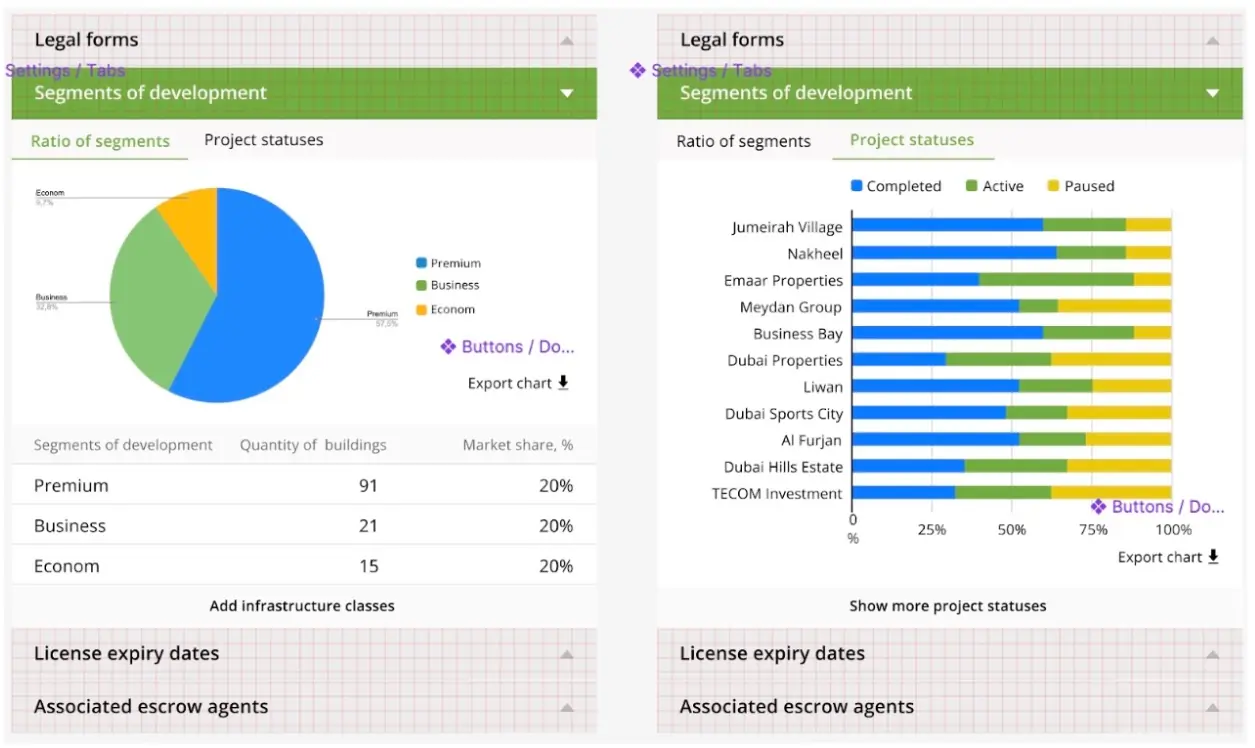 Screenshot. Crop of analytical charts for segments of development in Dubai, UAE.
Analytical visualizing data on charts
Complex business processes are easier to perceive in the form of linear graphs of the functions of the relationship between metric indicators and accompanying macroeconomic, price and risk indices in given periods of time in order to determine:
- what type of real estate is best to invest in based on business goals;
- in which area and master project is it more profitable to invest and in the medium term to minimize various possible urban risks;
- build your own investment strategy and capital growth through property management and rental business in Dubai.