Key user flow of users at GeoAnalytics
Published on
The Key User Flow in GeoAnalytics describes how a user executes one or more of our core use cases.
Below are two examples illustrating common workflows:
Use Case #1: Choice of Developer

Use Case #2: Choice of Property by Investment Strategy
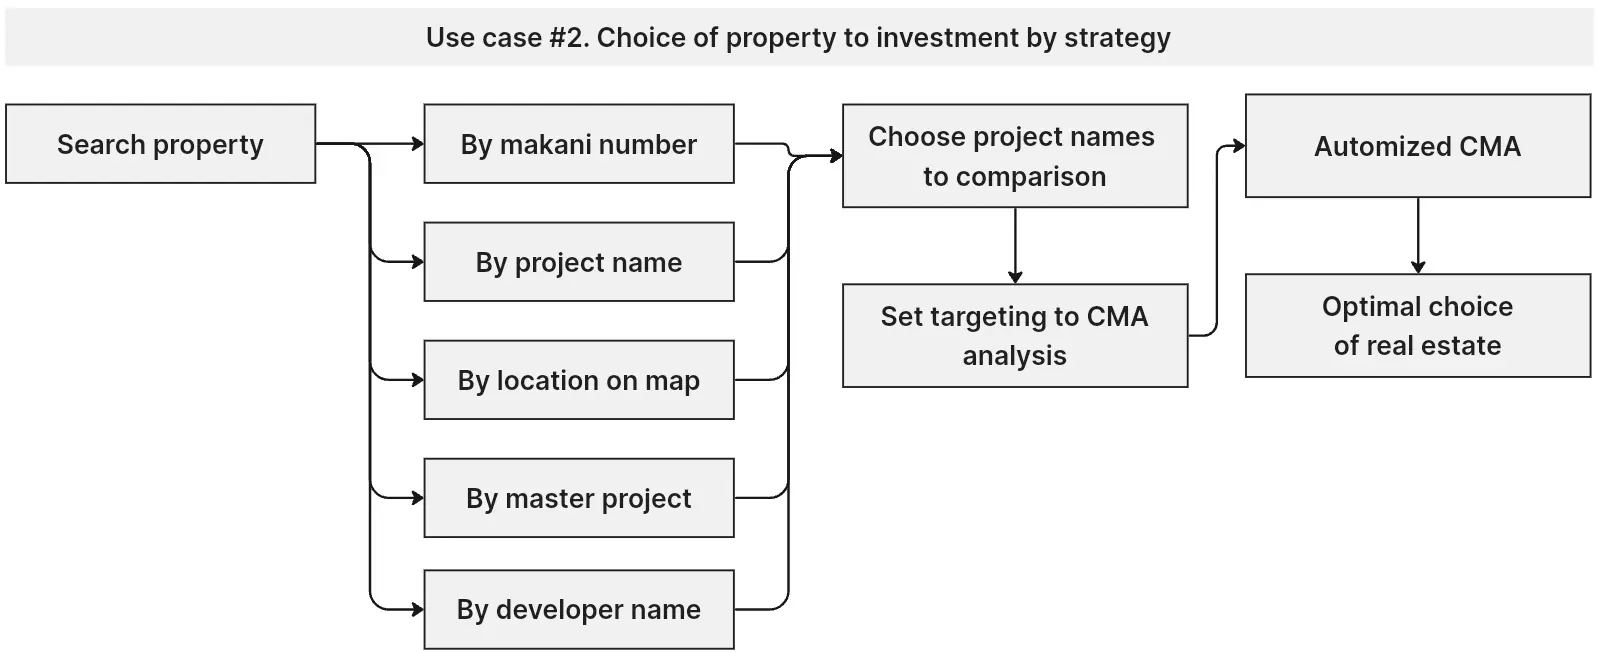
For example:
-
Choosing a Developer
Compare developers by portfolio and reputation to arrive at an optimal selection.
-
Selecting Property
Search by Makani number, project name, location, master project or developer, then run an automated CMA to find the best real estate investment.
Step-by-Step User Flow
Search Options
- By Makani number – precise location lookup
- By community name – broad search by neighborhood
- By master project – specific area of real estate development
- By developer project name – search by a specific development project name
Search Results
- Properties are displayed on an interactive map
- Each listing includes key property details
Investment Potential Evaluation
Risk Factors
- Crime rate analysis
- Flood risk assessment
- Transportation accessibility evaluation
Infrastructure & Accessibility
- Metro stations, major roads, and bus stops
- Parking availability and accessibility
- Commercial areas and building classification
Financial Metrics
- Cap Rate calculations – rental yield estimation
- ROI assessment – return on investment
- Sortino Ratio – risk-adjusted performance
Comparative Analysis & Decision Making
Property Comparison
- User selects multiple properties for side-by-side evaluation.
- Comparison factors include:
- Price indexes per square meter (sq.m) – valuation insights
- Historical price trends – growth potential
- Risk-adjusted performance – investment optimization.
Report Generation & Export
Final Property Selection
- User finalizes preferred property options
Custom Report Creation
- Reports include selected parameters and analytics
Export Options
- CSV – spreadsheets and data analysis
- PNG – export fragment of map
- JSON – export analytics
- PDF – business reports
User scenario for real estate market analysis
The logic decomposition for this scenario is illustrated in the above flowchart and describes two tasks.
Task 1: Choose a reliable developer.
Task 2: Choose the best real estate (buildings) based on the ratio of price indices and investment risks.
The user's path in working with the interface of the GeoAnalytics IT product follows from searching for a geo-object of interest, including development projects of a developer of interest, to downloading the results in the form of a standard report on the selected block of geo-analytical data.
- Periodical report for communities, master projects, development projects by deal type: sale or rent
- Comparison CMA report of chosen property
- Risk-management report