Price Radar for Investment Analysis
Published on
Overview
The Price Radar (Left Panel > Analysis > Price Radar) visualizes price-index metrics pulled from the Property Price Indexes API using a color-graded overlay within the radius you’ve set in Geo Monitoring.
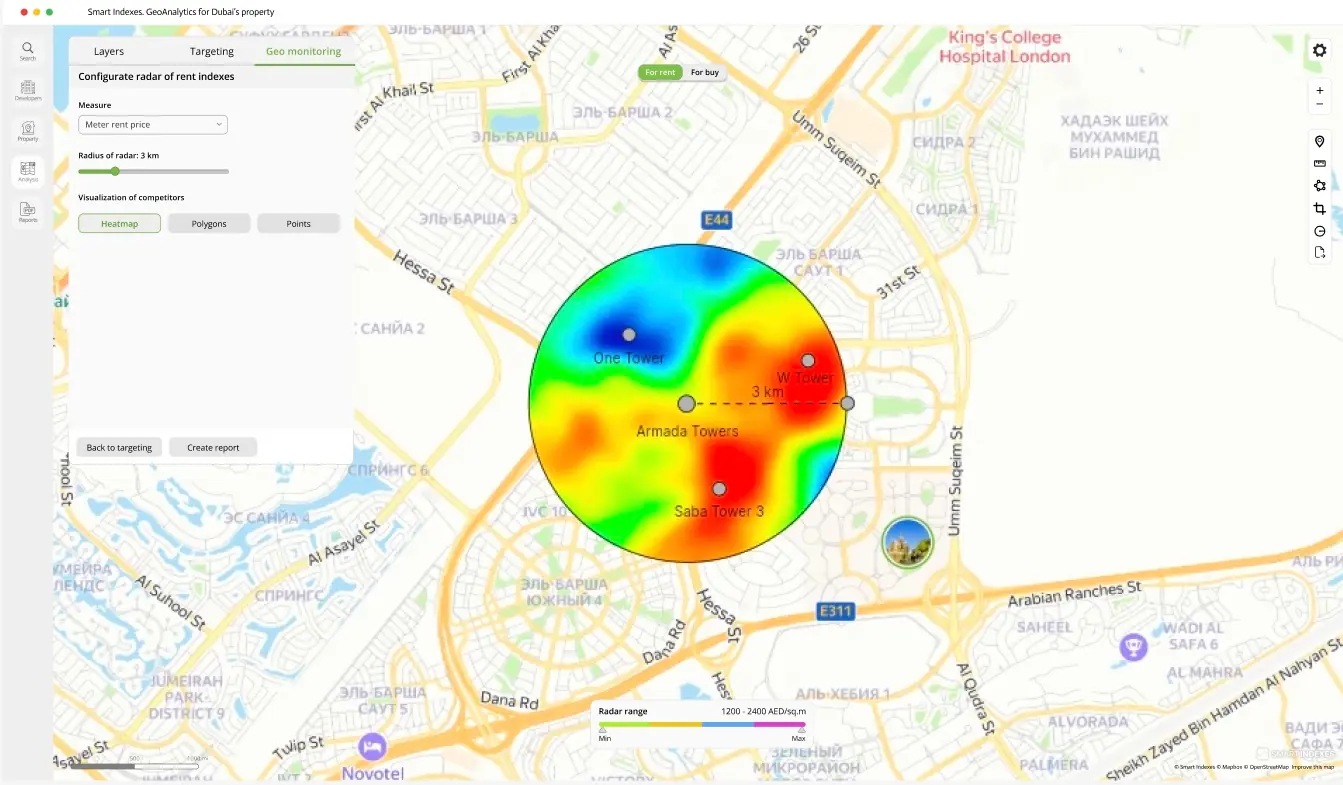 Price Radar in the Investment Analysis panel
It visualizes the spatial distribution of price-index metrics across the radius configured in Geo Monitoring.
Key Characteristics
-
Color-Graded Metrics
Displays the selected metric using a color palette ranging from minimum to maximum values.
-
Configurable Radius
Limits the color gradient to the map area defined by the Geo Monitoring radius.
-
Automated Data Loading
Pulls price indexes automatically from the Property Price Indexes API.
-
Latest Data
Uses the most recently completed month’s data to ensure accuracy in geo-analysis.