Geoanalytics of Dubai flood risk
based on meteorological and precipitation data
This case has been prepared by Smart Indexes for informational purposes only. The case demonstrates the capabilities of geoanalytics to solve complex business problems, including the analysis of the risk of flooding of areas, master projects and buildings when selecting promising real estate for investment in the Emirate of Dubai.
Geoanalytics of flood risk
Investment justification and protection of critical infrastructure
Solving a complex problem requires an integrated approach. In the context of choosing real estate for investment in Dubai, it is necessary to balance economic profit, meeting investor requirements and associated risks.
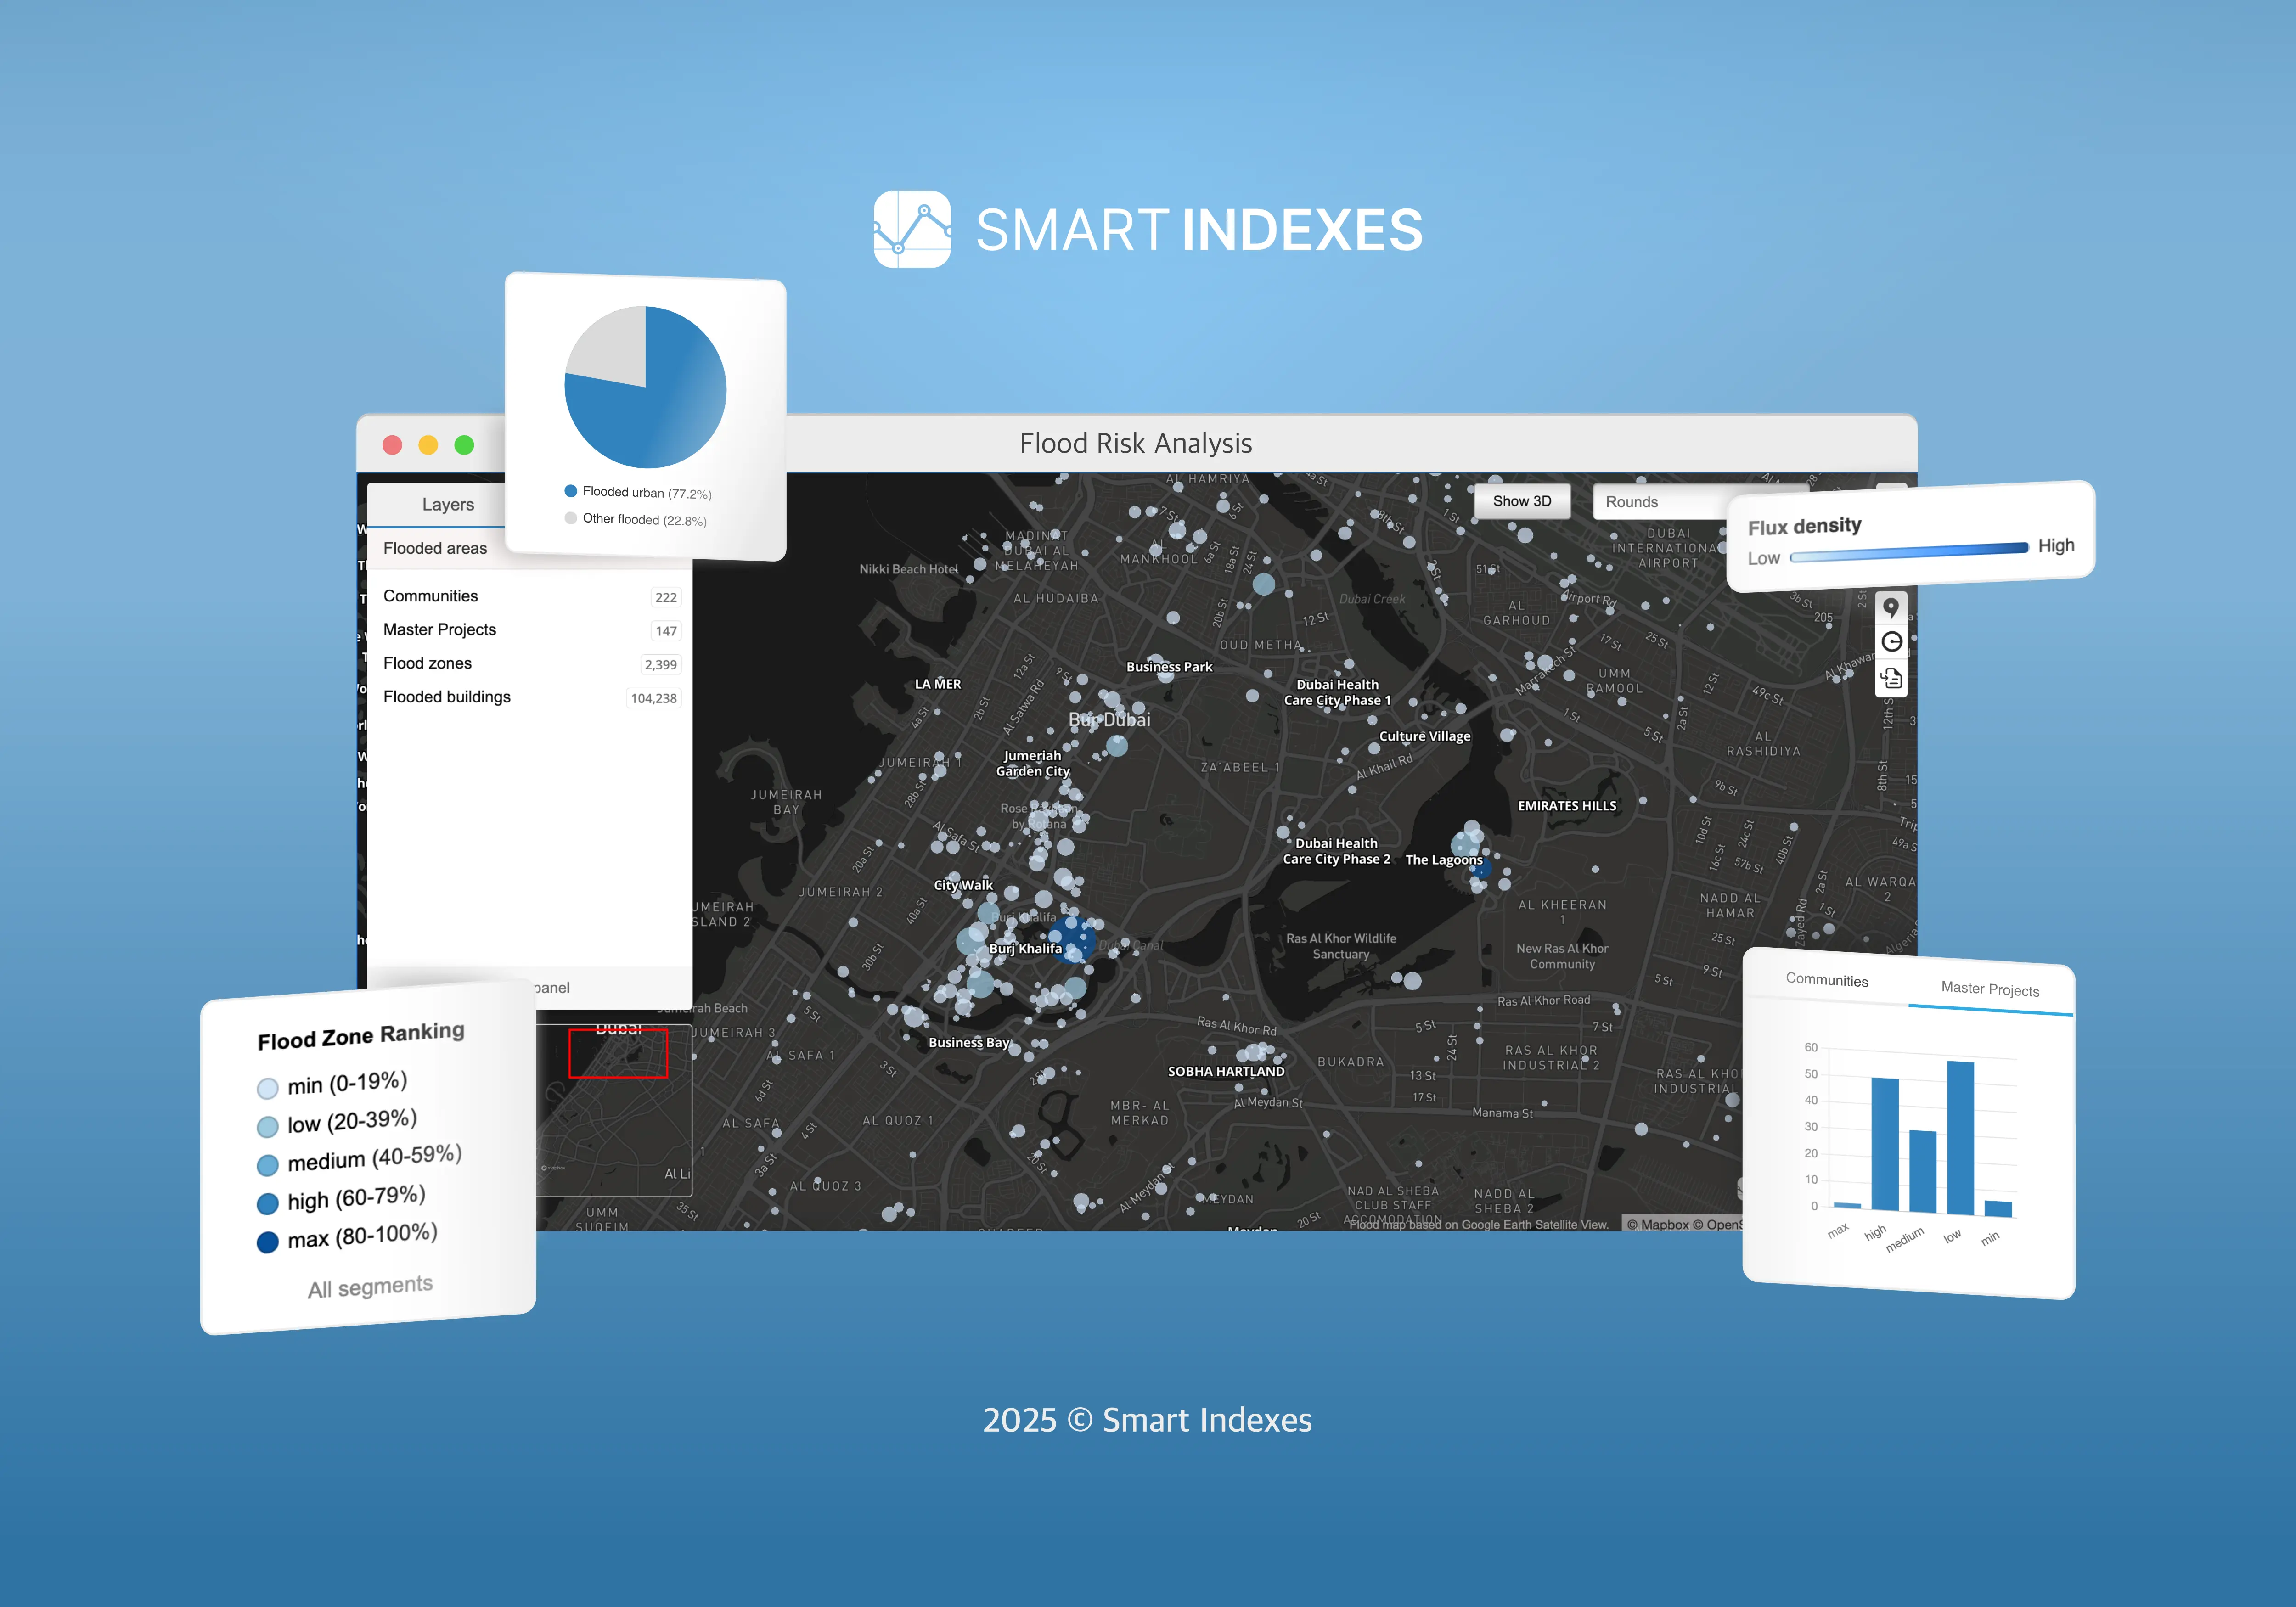
In this general task, the risk management case based on geoanalytics of flood risk contributes to the business community in particular in solving the related task of geoanalytical selection of real estate objects on the map, excluding locations with a potentially high risk of flooding.
Statement of the problem
General objective of the study
To assess the level of flood risk in the Emirate of Dubai based on real data without complex modeling.
.webp) Geoanalytical map of Smart Indexes “Flood Risk Analysis” — close-up of the Burj Khalifa area.
Geoanalytical map of Smart Indexes “Flood Risk Analysis” — close-up of the Burj Khalifa area.
Intermediate tasks
- Create a geoanalysis of flood risk by communities, master projects and buildings of the Emirate of Dubai.
- Prepare an electronic flood map with the following layers:
- Flooded communities
- Flooded master projects
- Flooded buildings
- Flood zones
- Upload geoanalytics with filters to the interactive Smart Indexes map “Flood Risk Analysis”
.webp) Closed scale master project Dubai Hills in the Flood Risk Analysis map.
Closed scale master project Dubai Hills in the Flood Risk Analysis map.
Video overview of the Flood Risk Analysis map
Introduction to the Problem
Compared to the study published several years ago, «Sea Level Rise Projection» (source: Earth.Org), which presents a flooding scenario based on mathematical modeling of the rise in water levels in the Gulf in the perspective of 2100, the Smart Indexes study includes geospatial analysis based on more approximate meteorological data for April 2024, when the Emirate of Dubai recorded an abnormal level of precipitation exceeding the norm for the spring season in the UAE.
.webp) Description of the Smart Indexes methodology for calculating the flood risk of communities in the Flood Risk Analysis map.
Description of the Smart Indexes methodology for calculating the flood risk of communities in the Flood Risk Analysis map.
Methodology for calculating the flood risk
The Smart Indexes analytics team used the structural decomposition for the administrative units of the Emirate of Dubai in preparation for the flood risk calculation methods:
-
Flooding risk — for Dubai communities (222 communities)
Calculation based on the sum of recorded flood zone areas (in a given community) in relation to the area of the community plot (plot area, km2),
forming the risk level in ranking from minimum to maximum (among all communities) on a qualitative scale:
- minimum (0-19%),
- low (20-39%),
- medium (40-59%),
- high (60-79%),
- maximum (80-100%).
- Flooding risk — for Dubai development master projects (147 master projects) A mathematical calculation was applied based on a number of variables: elevation height, distance of the center (or more precisely, the centroid) of the master project site from the perpendicular line to the nearest coastal border, flooded area (based on the inclusion or intersection of flood zone polygons and the master project).
- Flood risk — for all buildings in the Emirate of Dubai A geoanalytical (logical) rule was applied based on the inclusion or intersection of flood zone coordinates and administrative boundaries of buildings with a risk level calculated based on the flooded area relative to the area of the building site.
.webp) Geoanalysis of flood risk of Al Hebiah Fourth area on the map of Dubai, UAE.
Geoanalysis of flood risk of Al Hebiah Fourth area on the map of Dubai, UAE.
Important clarifications
- Mathematical simplification has been applied to the areas for transparency of risk level calculation.
- For master projects, the risk flooding is detailed and more accurate in terms of input coefficients for calculating the final risk in order to improve accuracy — for investment transactions in comparative analysis of promising real estate objects.
- For buildings — by coordinate inclusion of flood zones on the territory of buildings, so that there is a clear visual representation on the geoanalytics map of the flood risk relative to all buildings in the Emirate of Dubai, UAE.
Interpretation of the flood risk calculation methodology
In general, the calculation methodology in Smart Indexes seems to be empirically justified and in a number of use cases is more preferable than "global" modeling (up to 2100) for a number of reasons:
- The Smart Indexes methodology for Dubai flood risk includes real data from NASA satellite on flood zones, and not on predicted scenarios of sea level rise. More precisely, the actual flood zone polygons were used, rather than the modeled flood lines for 2100.
- The geoanalytical map based on the Smart Indexes methodology presented in the abstract provides point-by-point detailing within the administrative boundaries of communities, master development projects and constructed buildings. Visual comparison of flood zones and geo objects on the map — the most visual way for real-time geoanalysis when comparing buildings with the real estate of interest to the investor.
- Relatively simple and transparent categorization of risk by rank (0-19%, 20-39%, etc.) is easily interpreted by a business customer or urban planner.
- Allows you to compare geo objects by the level of flood risk (natural): communities, master projects and buildings.
Accuracy of coordinates for flood zones of the Emirate of Dubai
The original dataset of digitizing flood zones from satellite:
- Latitude:
54.950840705404886 - Longitude:
24.923109219276284
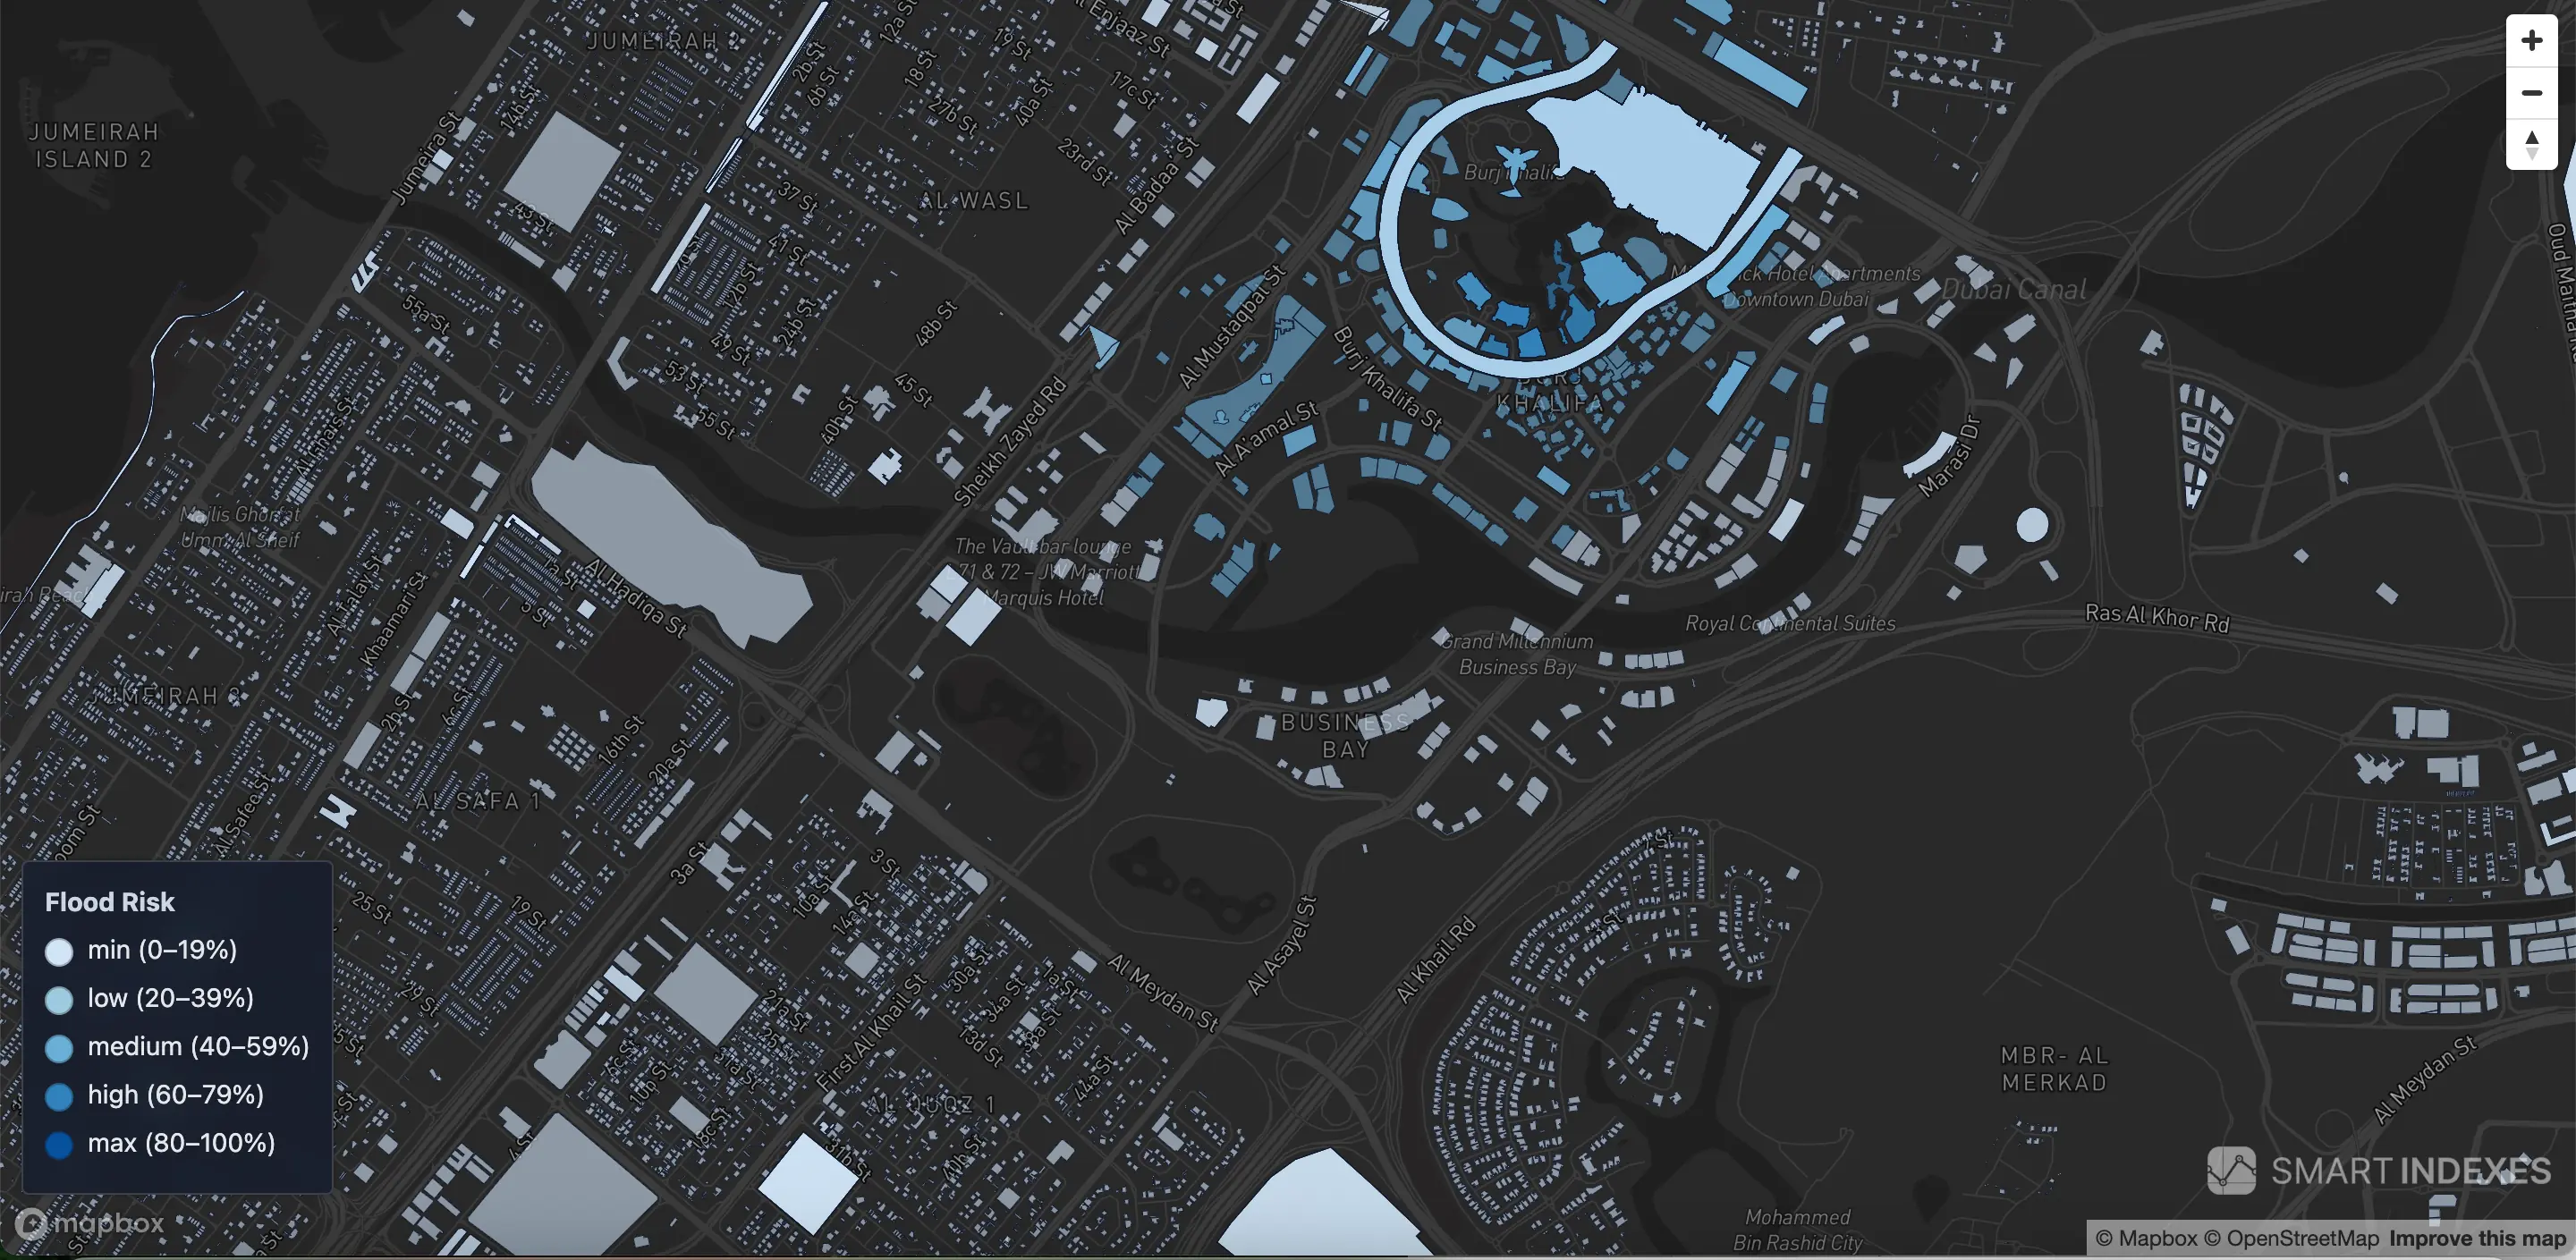 Color segmentation of flood risk for buildings in Dubai based on counted flooded area in radius 1 km from building entrance (Makani Number).
It presents the coordinates of flood zones with 15 decimal places (places after the decimal point), which corresponds to very high accuracy.
In the output of the Flood Zones Summary case on the map for operational display without losses - the coordinates have 6 decimal places, which gives an approximate accuracy of up to ~11 cm:
- Latitude:
55.369244 - Longitude:
24.965521
.webp) Flood zones on the map of the Emirate of Dubai, UAE — Flood Risk Analysis.
Flood zones on the map of the Emirate of Dubai, UAE — Flood Risk Analysis.
Benefits of using Flood Risk Analysis
The geoanalytical map prepared by Smart Indexes specialists has practical value for solving business problems:
- Color gradation and percentage marks of Flood Risk allow you to instantly assess the level of flood risk on the map.
- It helps to prioritize local measures to protect against floods here and now.
- It forms the basis for selecting promising buildings for investment, taking into account the risk of a natural disaster (flooding).
- The "Flood Risk Analysis" layers can be integrated into any GIS solutions: dashboards, reference books and custom filters
.webp) Study of the flood risk level of the Business Park master project on the map of the Emirate of Dubai, UAE — Flood Risk Analysis.
Study of the flood risk level of the Business Park master project on the map of the Emirate of Dubai, UAE — Flood Risk Analysis.
Interface of the Flood Risk Analysis geoanalytical map
The design of the flood risk analysis map is based on a format familiar to users with an analytics panel (on the left side of the screen) and a map with the following features:
- Standard map scaling: from a city view to zooming in on the level of buildings and flood zones.
- Enabling 3D viewing: an isometric view of the map of the Emirate of Dubai based on MapBox v.2.
- Legend with the flood risk level: switching the risk level of interest for quick targeting on the map.
- Color segmentation of flood risk: visual geoanalysis is provided with color gradation on the map to select safe locations on the map.
- Search by geo object name: by listing of communities, master projects, buildings.
- Ranking by risk levels: in listings of communities, master projects (in the left panel of the geoanalytical map).
- Details for the selected geo object: by community, by master project and building.
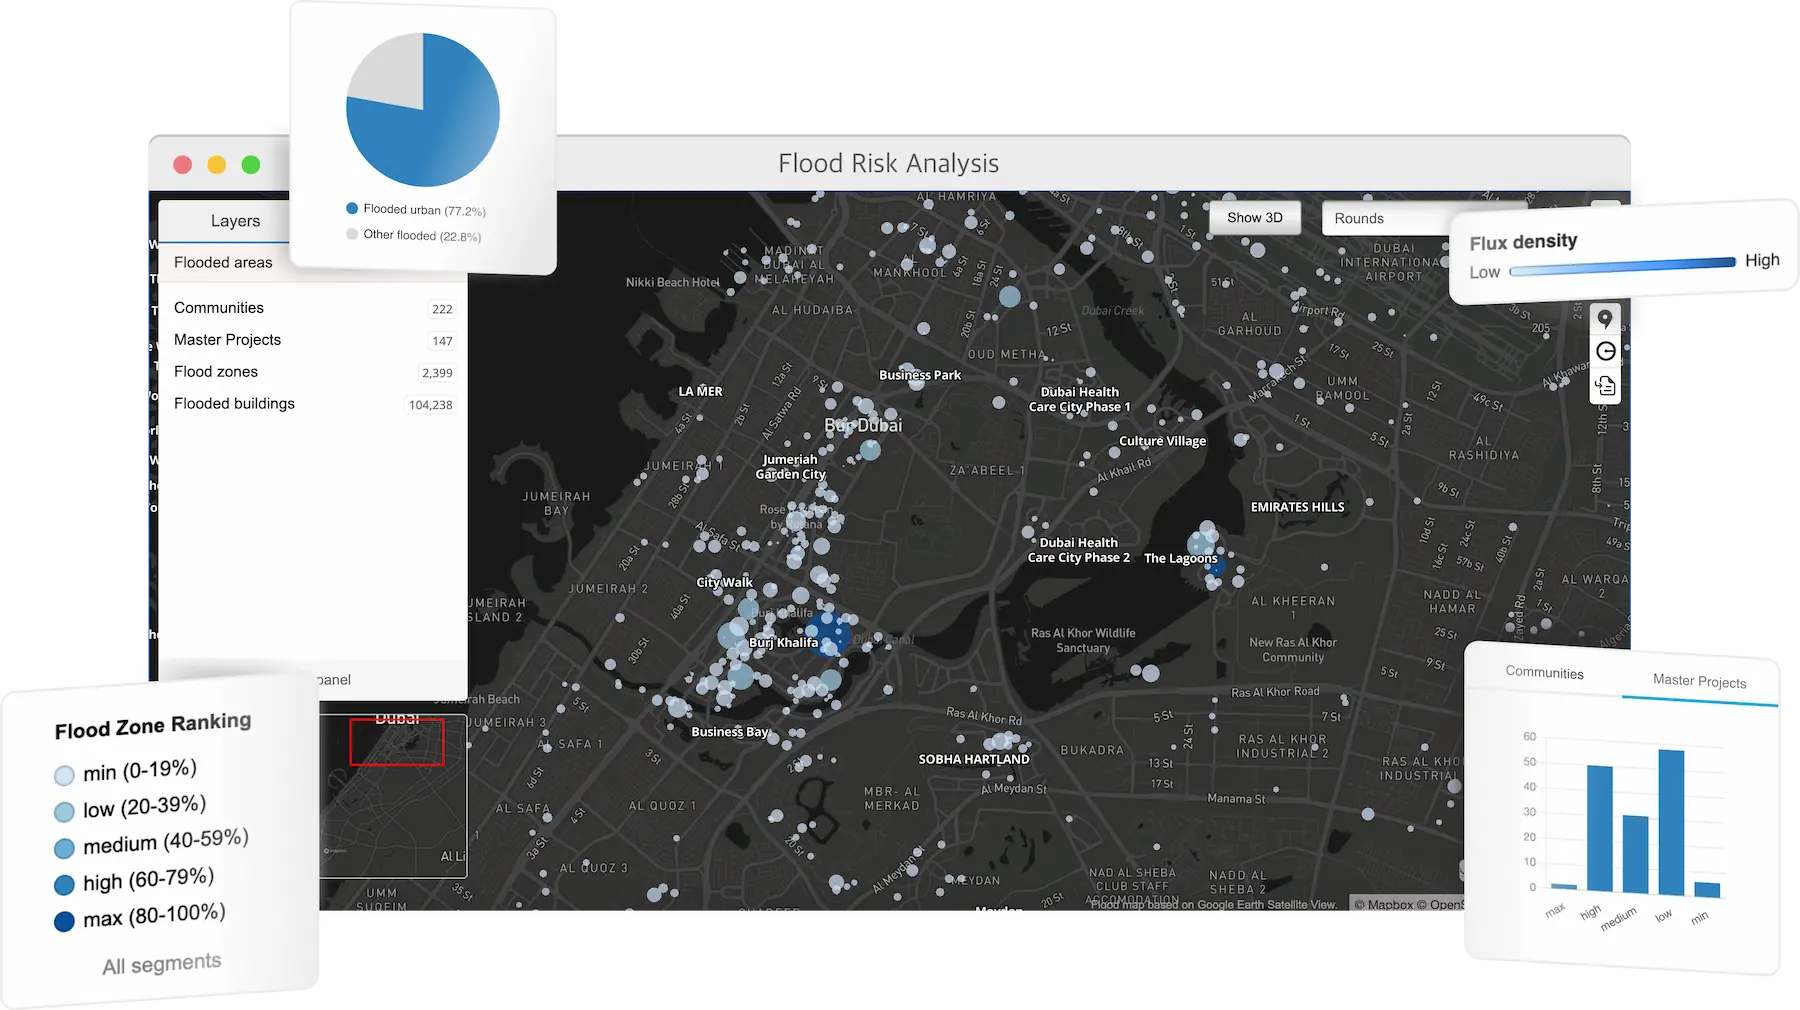 User interface of Flood Risk Analysis on GeoAnalytics map.
Conclusion
The proposed methodology for calculating the flood risk for the administrative units of the Emirate of Dubai provides business consultants with a transparent tool for selecting locations and investment objects taking into account the level of flood risk.
The practical value of the Flood Risk Analysis map lies in the prompt geoanalysis of the area taking into account various scenarios for selecting locations on the map: by community or by master project (by name if known in advance), by risk level or by a combination of factors, including Flood Risk Level.
Demo Flood Risk Analysis maps upon request
To study the interactive Flood Risk Analysis map, there is an opportunity in the form of an online consultation with real-time viewing and discussion of cooperation opportunities to solve your business problems.
Contact us — Smart Indexes team is open for cooperation.
Subscribe to our Telegram channel and stay up to date with Smart Indexes updates.
Subscribe