Dubai Flood Risk Analysis – April 2024
This flood-risk assessment blends open satellite data with proprietary Smart Indexes modelling. Its purpose is to provide an investment-oriented view of Dubai’s exposure to extreme-rain events; figures should be read as indicative rather than regulatory and may differ from future government audits or insurance-industry estimates.
Introduction
In Dubai, urban areas flooding ranks among the most intense weather-related threats to property.
In April 2024, Dubai experienced record-breaking rainfall and widespread flooding. These events highlighted the urgency of integrating flood risk into urban planning, infrastructure design, and real estate valuation models.
Video overview of the Flood Risk Analysis map
The resulting analysis by Smart Indexes aims to quantify and contextualize this flood event using satellite imagery, open geospatial data, and proprietary modeling techniques.
.webp)
Data Sources
This study utilized trusted sources, including:
- NASA satellite imagery (MODIS, Landsat 9) Source: https://earthobservatory.nasa.gov/images/152703/deluge-in-the-united-arab-emirates
-
NASA MODIS (Moderate Resolution Imaging Spectroradiometer)
Flooding in the Middle East
Source: https://modis.gsfc.nasa.gov/gallery/individual.php?db_date=2024-04-22
Image Facts
- Satellite: Aqua
- Acquisition Date: 2024-04-18
- Resolution: 1 km (218.3 Kb), 500 m (527.6 Kb), 250 m (308 Kb)
- Bands Used: 7,2,1
- Image Credit: MODIS Land Rapid Response Team, NASA GSFC
- Google Earth Engine A planetary-scale platform for Earth science data and analysis. Source https://earthengine.google.com/
- Dubai Pulse Public open datasets (e.g., Dubai Pulse community layers) Source: http://dubaipulse.gov.ae/
Overview of the Flood Event
Between April 14 and 16, three slow-moving low-pressure systems stalled over the Gulf, dumping up to 250 mm of rain—exceeding Dubai’s typical annual total—in eastern and northern parts of the UAE. Major transport arteries, including Sheikh Zayed Road, were inundated, and operations at Dubai International Airport were temporarily halted after it recorded 119 mm of rainfall on April 16.
Subsequent Landsat 9 imagery (April 19) revealed persistent floodwater across the industrial zone of Jebel Ali, coastal resorts south of Palm Jebel Ali, and key commercial hubs in central Dubai.
Fig. 1. NASA images of the Emirate of Dubai before and after the flooding in April 2024.
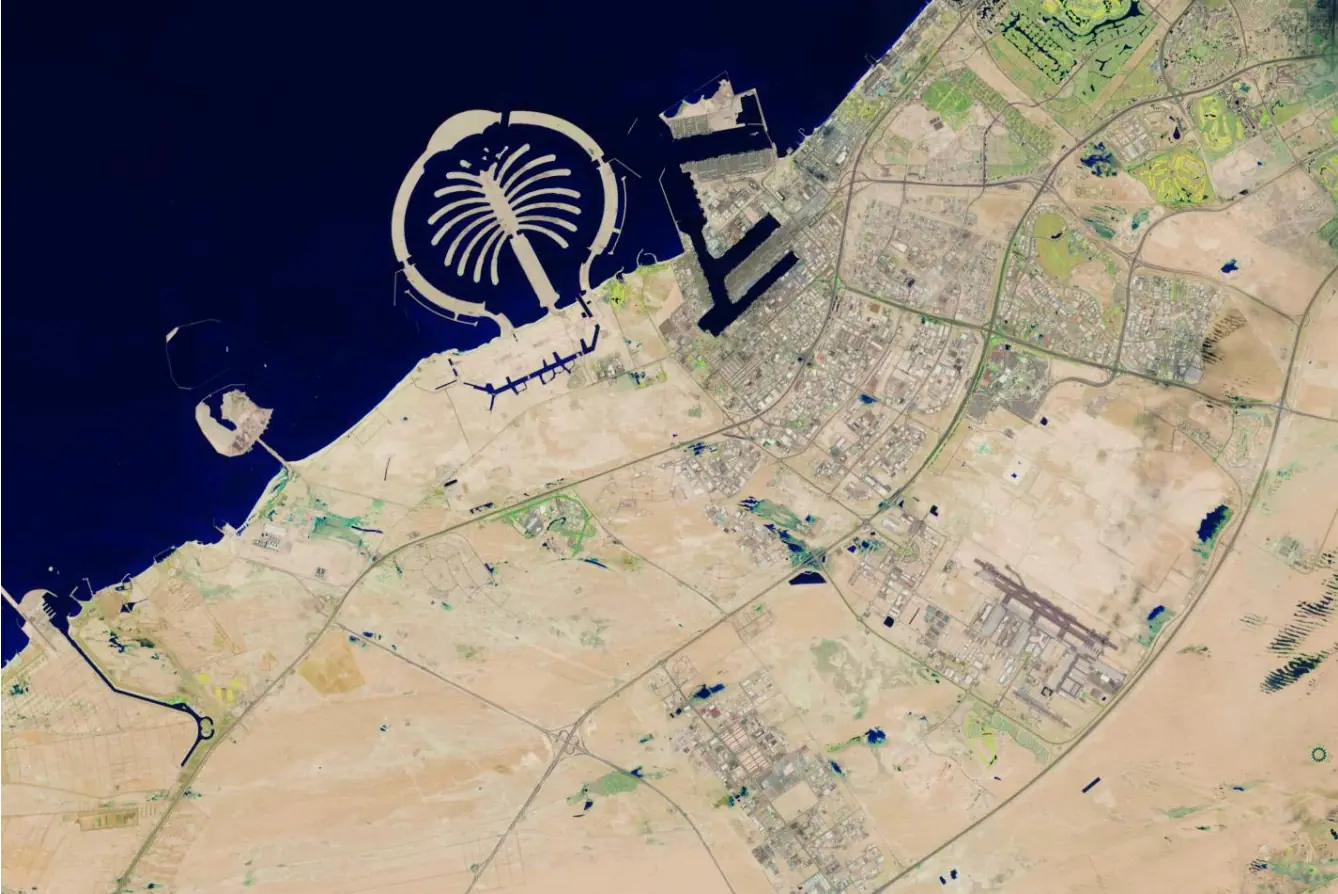 A. The NASA satellite image is dated April 3, 2024.
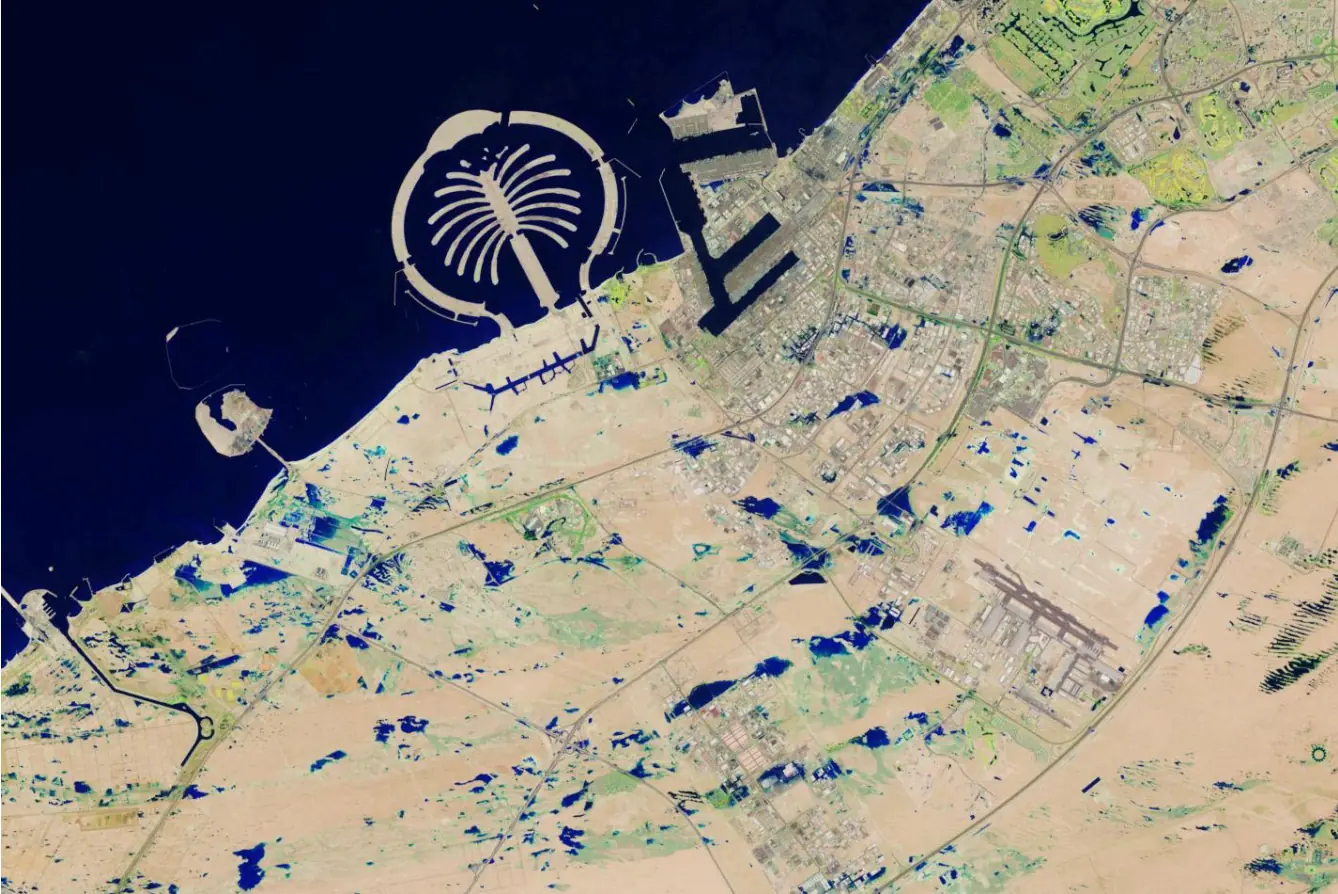 B. NASA satellite image dated April 19, 2024
Flood Statistics
- Urban area of Dubai: 4610 km²
- Total flooded area: 11.4 km²
- Total flooded urban area: 8.8 km²
- Flood zones identified: 2,398
Damage and Disruption
- Flights at Dubai International Airport were temporarily halted and experienced significant delays
- Major transport arteries including Sheikh Zayed Road were inundated, disrupting ground traffic
The publicly available estimate of the total area of the Emirate of Dubai is approximately 4610 km². Based on satellite analysis, the flooded area in April 2024 covered about 11.4 km², which represents roughly 0.25% of Dubai’s total territory.
Fig. 2. Visualization of digitized polygons of Dubai flood zones after analysis of NASA images.

Fig. 3. Enlarged fragment to illustrate flood zones in the Dubai Marina, Al Thanyah areas near the Persian Gulf coast.

Flood Risk Model by Smart Indexes
Smart Indexes introduced a multi-factor flood risk model incorporating:
- Rain Flood Risk: Ratio of flooded zones to total area
- Distance Flood Risk: Proximity to coastline
- Gulf Flood Risk: Elevation relative to sea level
This model leverages elevation data and geospatial mapping to calculate risk exposure at the community and master development level.
Risk Classification Levels
- Low Risk: 0–19%
- Medium Risk: 20–39%
- Elevated risk: 40–59%
- High Risk: 60–79%
- Max Risk: 80–100%
Most affected communities by flood
| Community name | Plot area, km² | Number of zones | Flood sq., km² | Risk, % |
|---|---|---|---|---|
| Mena Jabal Ali | 34.80 | 126 | 0.91 | 80 |
| Marsa Dubai | 8.90 | 93 | 0.29 | 60 |
| Business Bay | 6.60 | 103 | 0.35 | 60 |
| Madinat Al Mataar | 141.80 | 78 | 0.48 | 40 |
| Jabal Ali Third | 365.00 | 70 | 0.27 | 40 |
| Burj Khalifa | 2.70 | 61 | 0.25 | 40 |
| Dubai Int'l Airport | 14.20 | 36 | 0.17 | 20 |
| Jabal Ali First | 21.30 | 34 | 0.13 | 20 |
| Al Barsha First | 4.00 | 34 | 0.13 | 20 |
| Al Merkadh | 10.40 | 40 | 0.15 | 20 |
Government Response
The Dubai government allocated AED 2 billion (~$544M) for flood recovery. Emergency services coordinated evacuations and damage control. A long-term strategy is needed to enhance drainage capacity, update zoning codes, and deploy predictive flood modeling using satellite data and AI.
For geo analysis available Smart Indexes showcase «Map of flood zones» from satellite shots by Google Earth: in 2D and 3D.
 Fig. 4. A. Dubai flood zones in 2D Map by Smart Indexes
 Fig. 4. B. Dubai flood zones in 3D Map by Smart Indexes
Conclusions and Recommendations
- Urban planning must account for extreme rainfall events, including updates to Master Plan 2040
- Real estate risk indexing should include flood susceptibility in investment models
- Tourism was disrupted, affecting revenues and investor confidence in short-term rental zones
- Infrastructure needs modernization: Smart drainage, real-time flood alerts, and improved resilience design
The April 2024 Dubai floods showed the importance of preparing for extreme rainfall events and can serve as a model for cities in arid and coastal regions. The methodologies employed by Smart Indexes provide a scalable, data-driven framework for proactive disaster risk reduction.
Subscribe to our Telegram channel and stay up to date with Smart Indexes updates.
Subscribe

