Property Price Indexes API
Methodology Update (v1.2)
Updated on
This methodology describes how the Property Price Indexes (PPI) API computes monthly price and yield indicators for Dubai’s residential and commercial real estate markets, using officially registered sales transactions (DLD) and rental contracts (Ejari), with median-based aggregation and a strict geographic hierarchy (Project → Master Project → Community).
Coverage Period: January 2024 – dynamically extended monthly.
The API is updated every month after official DLD and Ejari data finalization.
1. Overview
The Property Price Indexes (PPI) represent aggregated market indicators derived from actual transaction data, including:
- Sale prices (AED / sqm)
- Rental rates (AED / sqm / year)
Indexes are calculated monthly for:
- Property segments (Residential / Commercial)
- Property types (Flats, Villas, Offices, Shops, Showrooms)
- Geographic areas (communities)
2. Data Source
All index values are based on:
- Verified transaction-level data
- Registered deals from the Dubai Land Department (DLD)
Each observation includes:
- Transaction value
- Property size (sqm)
- Property type and subtype
- Location (area)
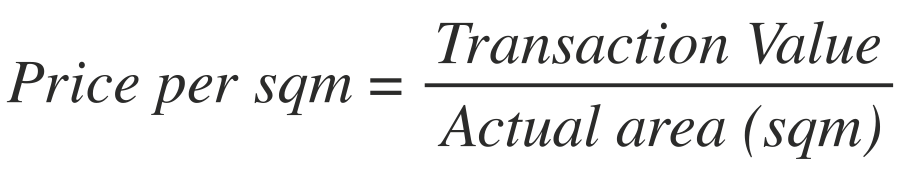
3. Base Metric
For each transaction:
4. Index Calculation by Property Type
For each:
- Area
- Month
- Property Type
The index is calculated as:
4.1 Core Method
- Median or weighted average price per sqm (depending on data availability)
- Outliers are filtered using internal thresholds
4.2 Data Sufficiency Rule
If the number of transactions is below threshold - value may be:
- Smoothed (carry-forward / interpolation), or
- Not reported (null)
5. Aggregated Index (ALL)
The "ALL" index represents a combined indicator across all property types within a segment.
5.1 Calculation Logic
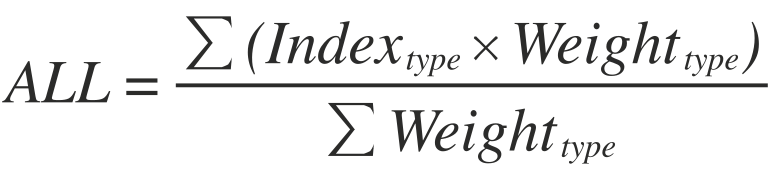
The ALL index is computed as a:
Weighted aggregation of available property types
Where:
Index_type= index value for each property typeWeight_type= proportional activity based primarily on transaction volume (count), with optional value-based normalization in low-liquidity segments
5.2 Key Principles
1. No Simple Averaging
The ALL index is NOT a simple average.
2. Dynamic Weighting
Weights are:
- Calculated per area per month
- Based on actual market activity
This ensures:
- Active segments influence the index more
- Illiquid segments do not distort results
5.3. Flexible Composition
The ALL index:
- Uses only available property types
- Automatically adjusts if some types are missing
Example:
- If only Shops data exists → ALL = Shops
- If Offices + Shops → weighted mix
6. Outlier Protection
If one property type:
- Dominates volume excessively
- Or shows abnormal deviation
Then:
- Weighting impact is naturally limited
- (Optional safeguards may be applied)
7. Handling Missing Data
If a property type has:
No transactions in a given month
Then:
- It is excluded from aggregation
- It does NOT bias the ALL index
8. Volatility & Interpretation
Users should consider:
Low-Activity Areas
In areas with limited transactions:
Index values may be more volatile
Dominant Property Types
If one property type dominates:
The ALL index may closely follow that segment
Month-to-Month Variations
Changes may reflect:
- Real market shifts
- Or changes in transaction composition
9. Geographic Aggregation Hierarchy
The API calculates values independently at each geographic level:
Transaction
↓
Project
↓
Master Project
↓
Community
There is no double counting across levels.
Each level aggregates only transactions belonging to that level.
A transaction belongs to exactly one:
- Development Project (
project_name_en) - Master Project (
master_project_en) - Community (
community_name_en)
Hierarchy mapping is based on official DLD geo-identifiers and maintained normalization hashmaps.
Missing project_number values are restored from authoritative DLD mappings when possible.
10. Minimum Transaction Threshold
To ensure statistical reliability, the system applies minimum monthly sufficiency rules before accepting a new observed value.
The default minimum threshold is applied by level and segment using internal validation rules.
In production configurations, the minimum threshold is typically not less than 3 transactions per period.
If the number of valid transactions is below the required threshold:
- No new stable observed median is enforced for publication mode
- The system may apply interpolation or LOCF depending on surrounding data availability and selected mode
This ensures that low-liquidity areas do not generate unstable month-to-month jumps from insufficient observations.
11. Smoothing, LOCF and Interpolation
The API supports continuous time-series logic for charting, benchmarking and historical analytics.
11.1 LOCF (Last Observation Carried Forward)
If a month has:
- No transactions, or
- Insufficient valid transactions under the active publication rule
The index carries forward the last valid observed value when no valid update is available under the active mode.
When LOCF is applied:
- Price values are carried forward unchanged
- Absolute monthly growth = 0
- Percentage monthly growth = 0
This ensures:
- Continuous time series
- Stable chart visualization
- No artificial volatility from empty periods
LOCF does not apply retroactively. Once new valid transactions appear, normal calculation resumes.
11.2 Interpolation
If a missing month is located between two valid months, the system may apply interpolation.
Interpolation is used only for short internal gaps and only to preserve continuity of the series.
Interpolated values are not new observed market medians. They are derived values used for smoothed analytical output.
Interpolation is limited to short gaps (typically 1–2 periods) and is never applied across long missing sequences.
11.3 Mode Logic in API Endpoints
The API supports mode-based retrieval inside the same endpoint structure.
- mode=observed – returns only directly observed market values; missing months may remain empty
- mode=smoothed – returns continuous analytical series using interpolation and LOCF
This allows API consumers to choose between:
- Strictly observed values for audit-style analysis
- Continuous smoothed values for charts, dashboards and time-series visualization
The mode parameter affects output behavior only and does not change underlying transaction-level calculations or aggregation methodology.
12. Currency Conversion
USD values are derived using a fixed exchange rate:
USD = AED / 3.67
This ensures consistency across periods.
The AED/USD rate is fixed at 3.67 to maintain longitudinal comparability.
The API does not apply floating FX adjustments.
13. Capitalization Rate (Cap Rate)
13.1 Formula

Where:
- Rent per sqm = monthly rental index value per sqm
- Sale per sqm = sale index value per sqm
- X = project age adjustment coefficient
13.2 X-Factor Logic
The X coefficient adjusts for structural lifecycle and yield normalization.
| Project Age | X Coefficient |
| < 10 years | 0.95 |
| ≥ 10 years | 0.90 |
| Unknown completion date | 0.90 |
13.3 Cap Rate Availability
Cap Rate is calculated only when both rent and sale values are available for the same period and level.
Cap Rate is not computed from individual transactions, but from aggregated median-based indices.
If either side is missing, Cap Rate is returned as empty value.
Cap Rate monthly growth is calculated only when both current and previous Cap Rate values exist.
In smoothed mode, carried-forward and interpolated sale/rent values may also support continuous Cap Rate calculation.
13.4 Stability Adjustment
To ensure analytical consistency and prevent distortion in low-liquidity segments, Cap Rate values may be subject to upper-bound stabilization.
In production outputs, Cap Rate is capped at 20% to eliminate extreme values caused by temporary imbalance between rental and sales data, particularly in cases of interpolated or low-volume observations.
This adjustment does not alter underlying price or rent indices, and is applied only at the final indicator level.
14. Growth Rate Calculation
For each metric the API calculates monthly growth in two forms:
14.1 Absolute Growth

14.2 Percentage Growth

Growth values are returned as:
- Empty value when previous value does not exist
- 0 when value is carried forward via LOCF
- Numeric value otherwise
15. Data Integrity Rules
The system applies the following controls:
- Land is excluded from building price indexes
- Residential and Commercial are never mixed
- Subtypes are calculated independently
- Missing project_number values are restored from authoritative DLD mappings when available
- Null project identifiers are backfilled from authoritative mappings where possible
- Each transaction is used only once within its assigned geographic level
- Project names are normalized via official DLD registry and maintained hashmaps
- Community and master-project hierarchy is normalized using maintained geo-mapping layers
- Transactions with zero, negative, or missing area are excluded
- Zero or invalid price entries are excluded
- Renewal rental contracts are treated equally with new contracts
- Duplicate officially registered contracts are preserved as valid market transactions
16. Historical Existing Stock Reconstruction
Historical existing stock is reconstructed as a cumulative monthly series from registered property records and available DLD project completion information.
16.1 Stock Sources
The canonical existing stock uses:
- Units.csv as the primary source for Flats, Offices and Shops
- Buildings.csv as the authoritative source for Villas and Townhouses
Villa and Townhouse records are not added from Units.csv to the canonical stock when Buildings.csv is authoritative, preventing double counting between property and building-level records.
16.2 Property Appearance Date
The historical appearance date of an existing property is resolved using the following priority:
completion_datefrom the corresponding DLD Development Projectproject_end_datefrom the corresponding DLD Development Project whencompletion_dateis unavailableconstruction_yearof the corresponding Master Project when no project-level completion date can be recovered- Historical baseline when no reliable completion date is available from the supported DLD sources
16.3 Historical Baseline
The historical stock series begins in January 2024.
Properties known to have existed before January 2024 are included in the January 2024 baseline.
Existing registered properties for which an exact historical completion date cannot be reconstructed from the available DLD project data are also assigned to the January 2024 baseline.
This baseline assignment does not mean that such properties were completed in January 2024. January 2024 is the technical starting boundary of the published historical series.
16.4 Cumulative Stock Logic
Historical stock is cumulative by month.
Once a property enters existing stock, it remains included in each subsequent monthly stock period unless it is separately identified as inactive, demolished, cancelled or otherwise excluded under the stock integrity rules.
For example:
- A property completed before January 2024 is included from the January 2024 baseline onward
- A property completed in June 2024 enters the historical stock in June 2024 and remains included in subsequent months
- A property completed in December 2025 enters the stock from December 2025 onward
16.5 Snapshot Reconciliation
The reconstructed historical series is calibrated against the latest available existing-stock snapshot.
At the stock snapshot month, cumulative historical stock must reconcile with the full canonical existing registered stock produced from the same Units and Buildings sources.
This reconciliation prevents historical reconstruction from representing only the subset of properties for which project-level completion dates are available.
16.6 Historical Stock Limitations
Historical stock before the latest snapshot is a reconstructed analytical series rather than a sequence of independent monthly DLD stock snapshots.
The accuracy of the reconstructed month of entry depends on the availability and quality of Development Project and Master Project completion information.
Where no reliable historical completion date can be recovered, the property is preserved in total existing stock through the historical baseline rather than excluded from the market structure.
17. API Outputs
Each API endpoint returns:
- Price per sqm (AED, USD)
- Rent per sqm (AED, USD)
- Cap Rate
- Subtype breakdown
- Monthly growth (absolute and percent)
- Period (YYYY-MM)
- Geographic identifiers
- data_source flags for each calculated metric
Endpoints are available for:
- Residential
- Commercial
- Communities
- Master Projects
- Individual Development Projects
The API supports retrospective range-based retrieval using:
- period_from
- period_to
- page
- limit
- mode
Each response includes:
- total
- count
- page
- pages
- has_next
This enables deterministic historical backfill for:
- Development Projects
- Master Projects
- Communities
- Residential and Commercial separately
18. Strengths of the Methodology
- Institutional-grade aggregation logic
- Deterministic reproducibility of results
- Median-based robustness
- Multi-level geographic hierarchy
- Independent subtype calculations
- Yield-adjusted Cap Rate with X-factor
- Transparent growth formulas
- Continuous time-series logic
- Production-grade data controls
- Deterministic pagination for historical backfill
- Strict schema stability
- No aggregation leakage between levels
- Full subtype isolation
- Production-grade LOCF continuity control
- Flexible observed vs smoothed mode logic
19. Limitations
- Requires sufficient transaction volume for strong observed values
- Dependent on DLD and Ejari reporting accuracy
- Fixed AED/USD rate does not reflect FX fluctuations
- LOCF may temporarily smooth volatility in low-liquidity areas
- Interpolation produces analytical continuity, not new market observations
- Cap Rate age coefficient is simplified (binary model)
- No hedonic quality adjustment is applied
- No transaction weighting by property size beyond per-sqm normalization and aggregation logic
20. Quality Control
The system applies:
- Outlier filtering
- Minimum transaction thresholds
- Consistency checks across time series
21. Summary
The PPI methodology ensures:
- Data-driven property pricing indicators
- Market-representative weighting
- Robust aggregation across property types
- Flexibility for sparse datasets
22. Conclusion
The Property Price Indexes API provides:
- Statistically stable market indicators
- Transparent calculation logic
- Robust outlier resistance
- Multi-layer geographic insights
- Yield-adjusted investment metrics
- Flexible observed and smoothed retrieval modes
The methodology is suitable for:
- Institutional reporting
- Market analytics platforms
- Banking and valuation use
- Investor dashboards
- Data distribution via API
Help & support
If you have any questions using the API, questions or want to upgrade to a paid plan, please contact us on support@smartindexes.com.
Contact us to register your app
To register your application and obtain API credentials or to book a short consultation reach us via Google Meet, WhatsApp, or email.
Also you can Register App using web form right now.
Email: support@smartindexes.com
Subject:
Please include:
- Company / contact name and role.
- Use case (research, pricing, underwriting, portfolio, etc.)
- Data scope (Communities, Master Projects, Project Names; residential/commercial; subtypes).
- Actual analytics: rent price per sqm, sales price per sqm, Cap Rate, growth.
- Estimated monthly requests.
- Preferred plan (Starter / Pro / Enterprise) and desired start date.
- Whether redistribution/embedding rights are needed.
We’ll reply with next steps, pricing, and access instructions.