Dubai Flood Risk Analysis
Published on
Published on
Methodology based on April 2024 data
Introduction
In early April 2024, Dubai recorded meteorological events in the form of increased rainfall. These meteorological events highlight the importance of considering the risk of flooding of residential, industrial and public areas of districts and master development projects implemented in Dubai.
In terms of property valuation, market models for pricing per square meter based on infrastructure (type, subtype, class, property segment and location) need to be modified to take into account known risks, including the existing risk of flooding in Dubai, so that the valuation has a realistic characteristic with variable risk components.
Disclaimer
This study is of an exclusively introductory nature for the purpose of an independent assessment of the flooding threats to the Emirate of Dubai, UAE, when modeling a multifactorial analysis of the investment attractiveness of real estate in this promising region.
Sources
This methodology used the following trusted data sources.
NASA photos
Source: https://earthobservatory.nasa.gov/images/152703/deluge-in-the-united-arab-emirates
Flooding in the Middle East.
Facts about the image
Satellite: Aqua
Date of receipt: 18.04.2024
Resolution: 1 km (218.3 KB), 500 m (527.6 KB), 250 m (308 KB)
Used ranges: 7,2,1
Image credit: MODIS Land Rapid Response Team, NASA GSFC
Google Earth Engine
Planetary-scale platform for Earth science data and analysis.
Source: https://earthengine.google.com/
Flood review
According to NASA, a slowly moving storm system hit the United Arab Emirates and dropped more than a year's worth of rainfall on some cities in April 2024. Heavy rains triggered flash floods in the eastern parts of the country, submerging roads and disrupting the transportation system.
The system first struck Oman on April 14 and continued to hit the UAE for most of the day on April 16. Michael Mann, a climatologist at the University of Pennsylvania, told the Associated Press that three low-pressure systems formed a series of storms slowly moving along the jet stream — a river of air that carries weather systems toward the Persian Gulf. A strong low-pressure system brought several rounds of strong winds and heavy rains to the northern and eastern parts of the country.
Some areas remained flooded on April 19, when Landsat 9 first passed over the region after the storms. The image above (right), taken that day with the OLI-2 (Operational Land Imager 2) satellite, shows flooding in Jebel Ali, a city located 35 kilometers (22 miles) southwest of Dubai. The image uses false colors (bands 6-5-3) to highlight the presence of water, which appears blue. Flooding can be seen in the Jebel Ali industrial zone south of the port and around green resorts and parks south of Palm Jebel Ali.
Parts of Abu Dhabi, the capital of the UAE, were also flooded by storms. The Landsat 9 images above show the city and its surroundings on April 3 (fig.1-A) and April 19 (fig.1-B), before and after the storms. On April 19, water can be seen covering Sheikh Zayed Road, the main transportation artery running through Dubai and Abu Dhabi. Areas of flooded land are also visible in Khalifa City and Zayed City, residential areas southeast of downtown Abu Dhabi.
The National Center of Meteorology of the UAE reported that up to 250 millimeters (10 inches) of rainfall fell in the eastern parts of the country in less than 24 hours. The UAE, known for its dry desert climate, receives only about 140–200 millimeters (5.5–8 inches) of rainfall per year.
The visual characteristics of the state of the territories of the Emirate of Dubai before and after the flood are presented in Figure 1.
Fig. 1. NASA images of the territory of the Emirate of Dubai before and after the flood in April 2024.
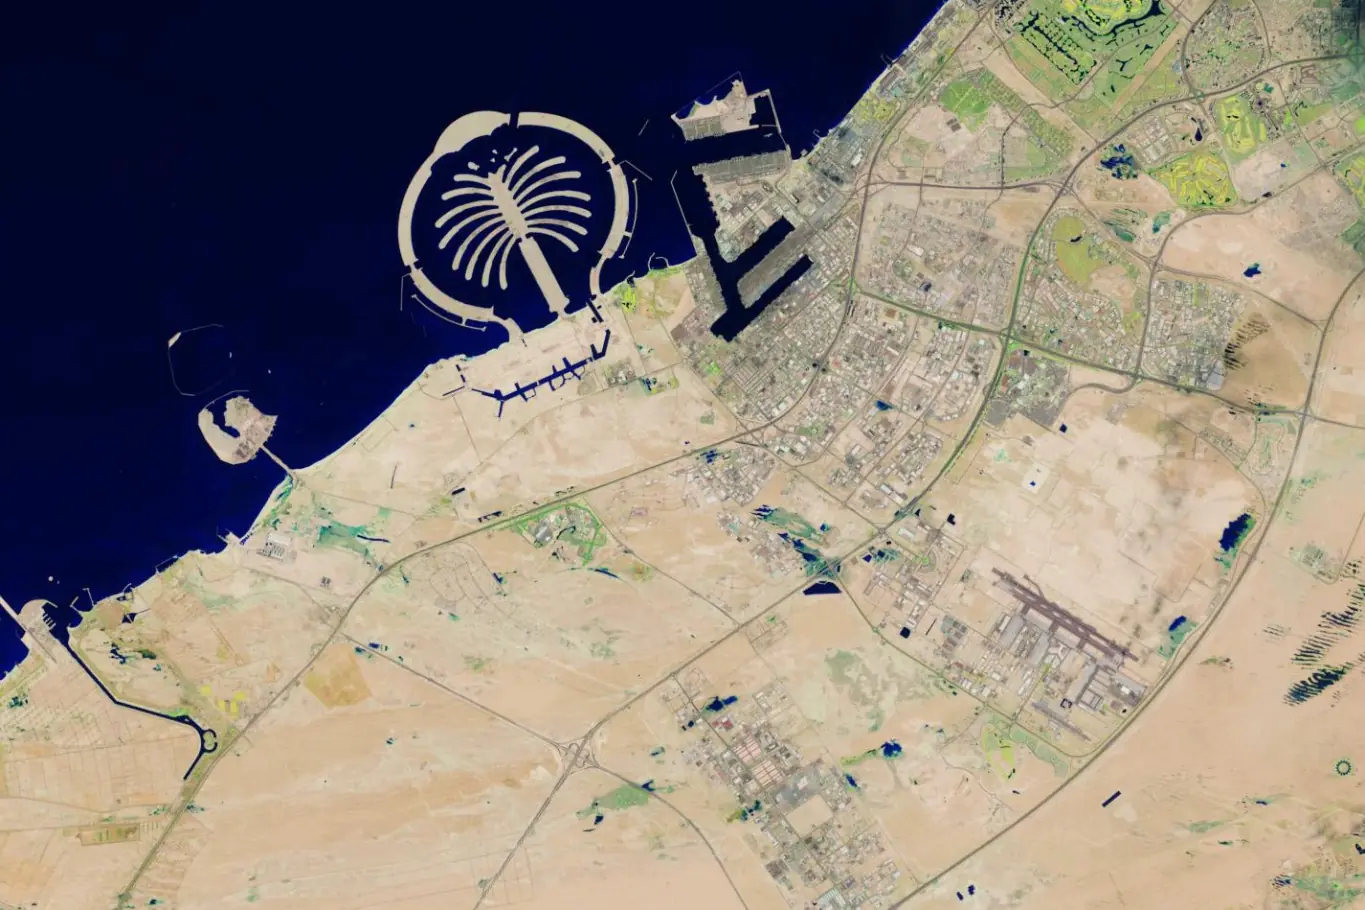 A. Satellite image from NASA dated April 3, 2024.
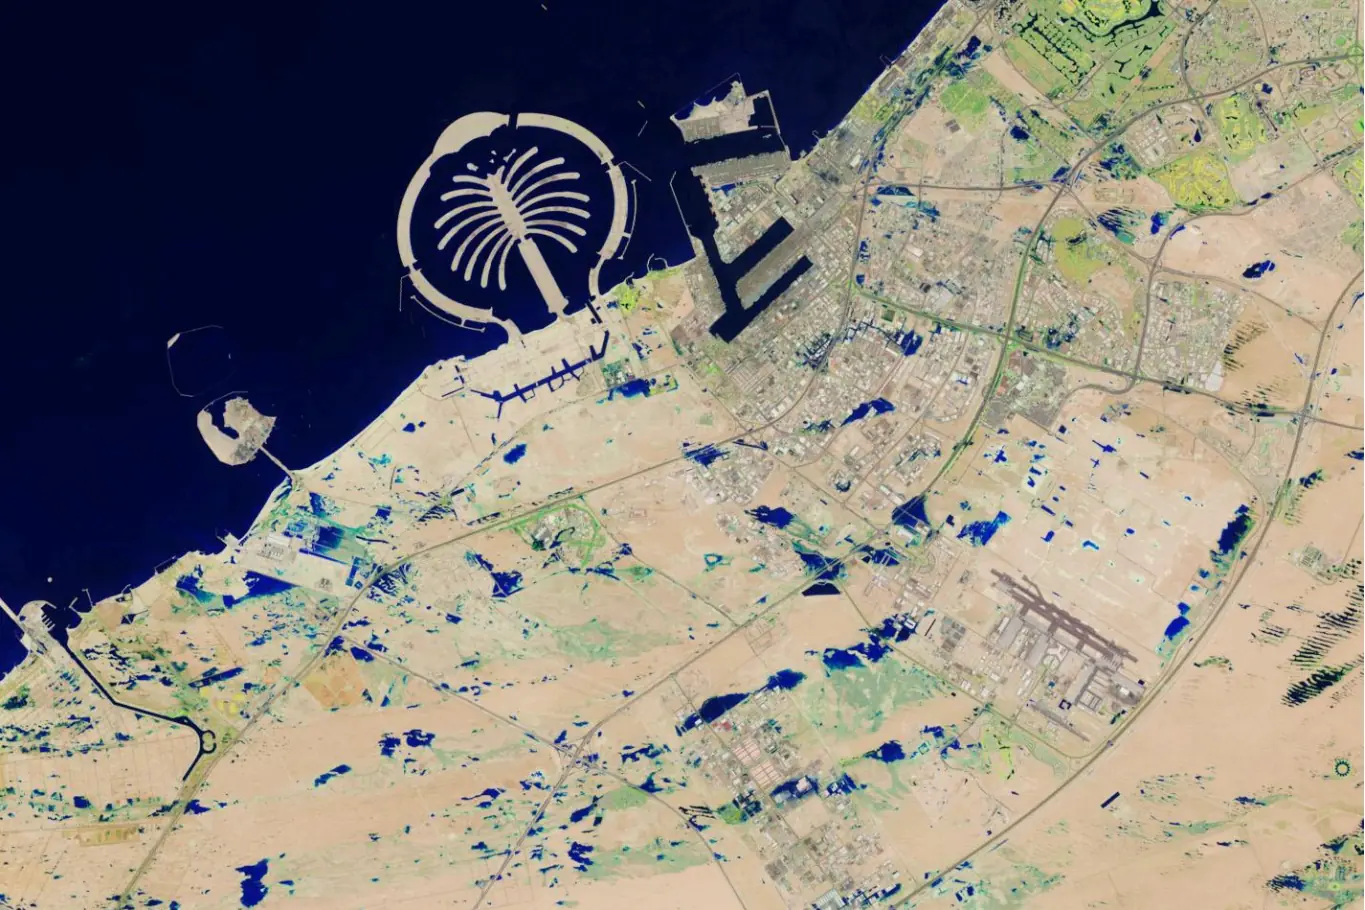 Fig. 1. NASA images of the territory of the Emirate of Dubai before and after the flood in April 2024.
B. Satellite image from NASA dated April 19, 2024.
At Dubai International Airport (northeast of these images), 119 millimeters fell on April 16, which is 1.5 times the usual annual amount of precipitation. Due to the flooding, flights were temporarily suspended at the airport, which is one of the busiest in the world for international travel.
According to news reports, as of April 18, some UAE were working on recovery after the flooding. It is reported that there are still delays at Dubai International Airport.
NASA Earth Observatory images taken by Wanmei Liang using Landsat data from the U.S. Geological Survey.
Flood statistics
Using the method of digital polarization of images from NASA, presented in the public service Google Earth before and after the flood of April 2024, the following results were obtained for the Emirate of Dubai:
Total flood area: 11.4 km².
A total of 2398 flood zones have been recorded.
Both coastal tourist areas and residential neighborhoods, as well as the DXB airport, were affected.
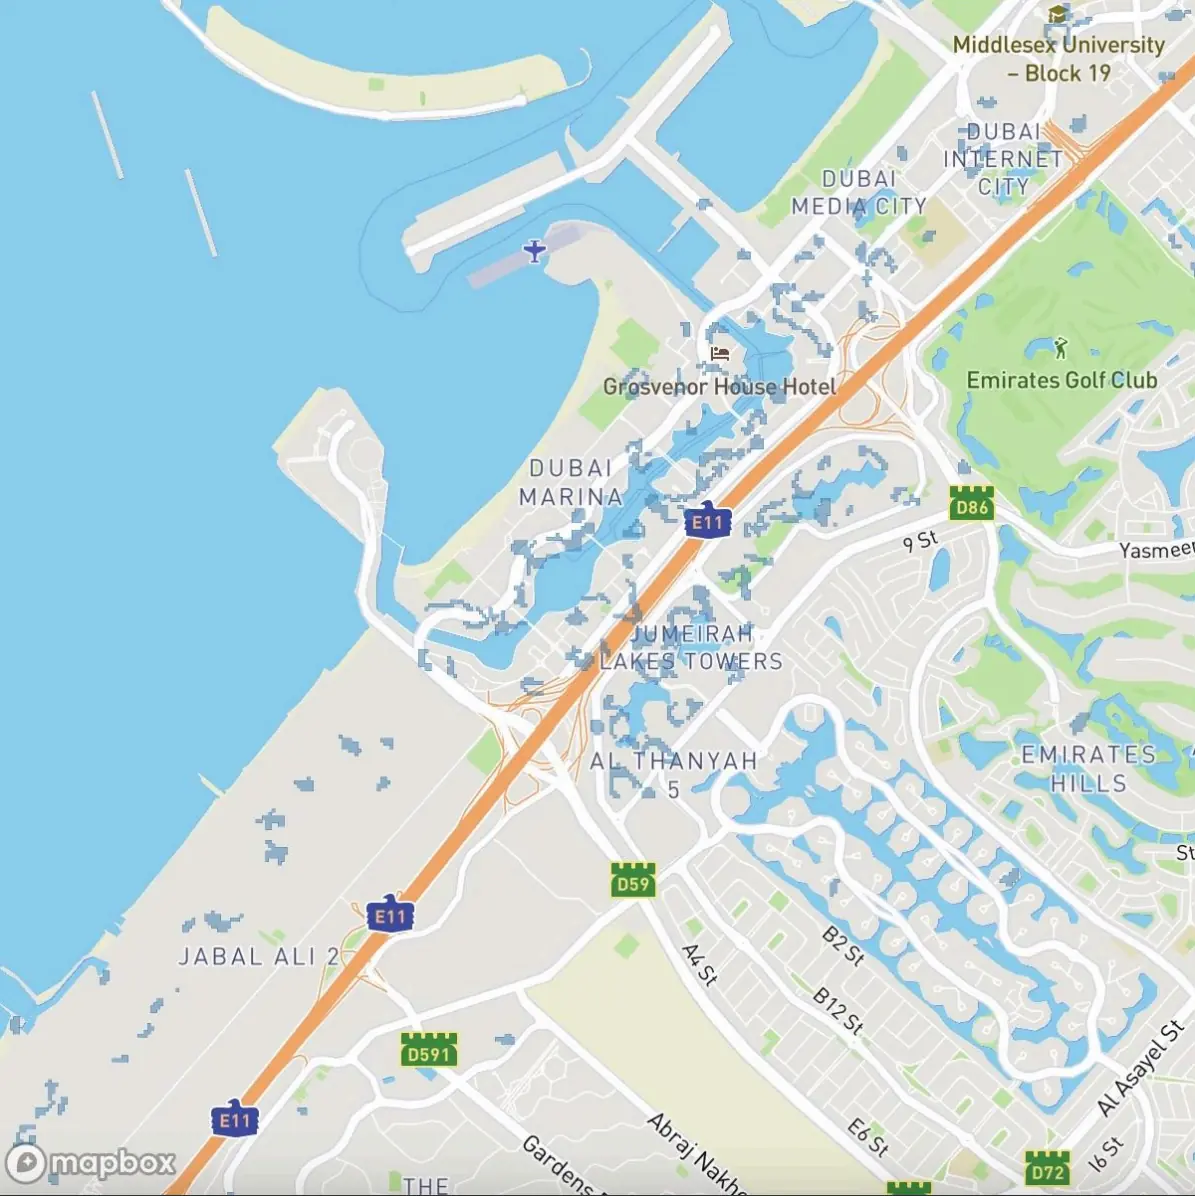 Fig. 2. Visualization of the digitized polygons of the flood zones in Dubai after analyzing NASA images.
Source: Smart Indexes
The publicly available assessment of the entire area of the Emirate of Dubai is 3,885 km², excluding the adjacent desert. In fact, the flooded area accounted for 0.3% of the total area of Dubai.
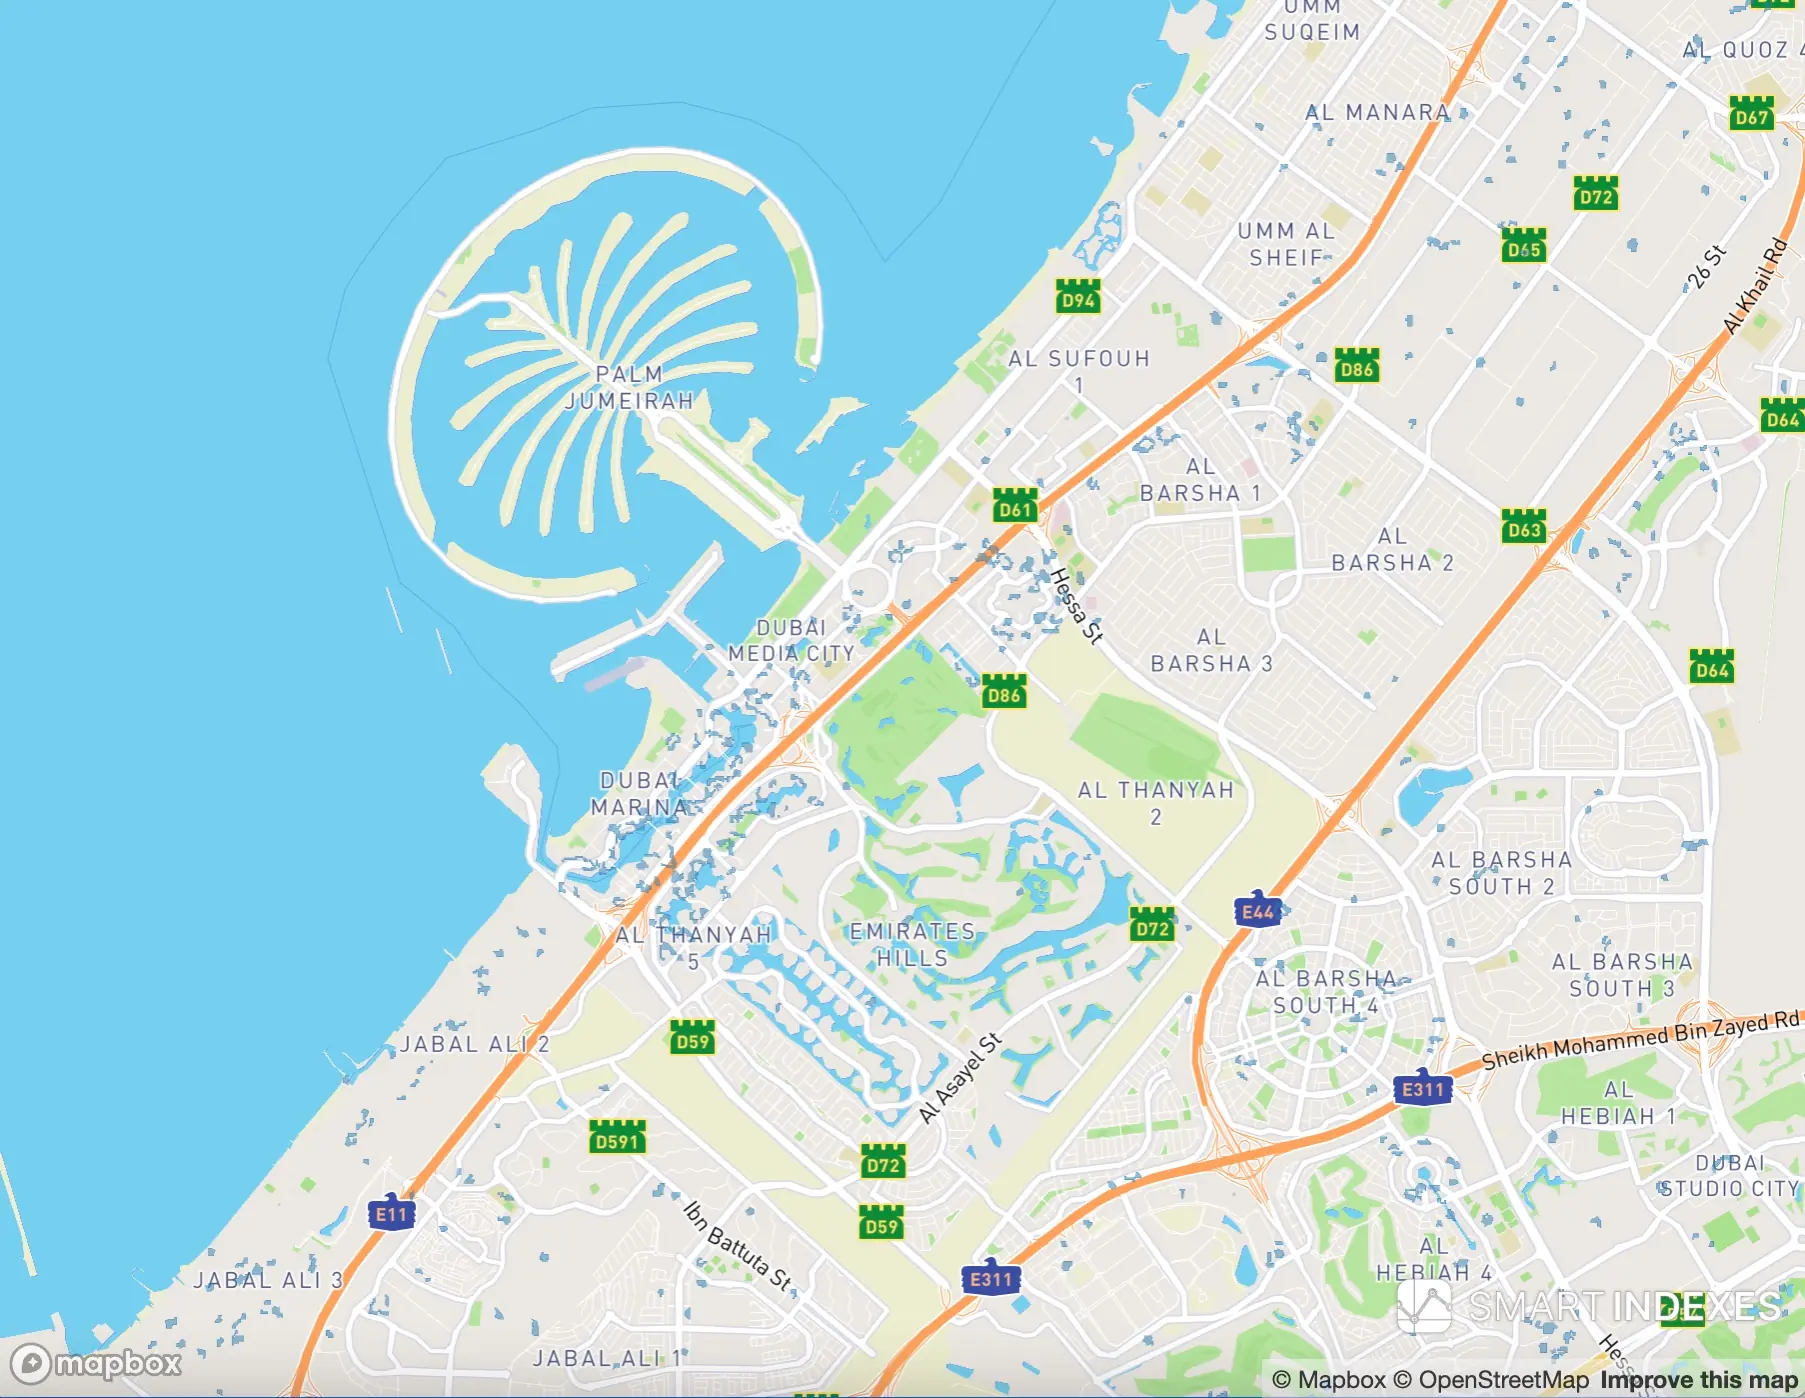 Fig. 3. Enlarged fragment to illustrate flood zones in the Dubai Marina, Al Thanyah areas near the coast of the Persian Gulf.
The total flood area: 11.4 km2 — this is a relatively small figure, but for investment assessment, it represents a significant risk factor that should be considered in the model for evaluating the investment attractiveness of real estate in Dubai.
As is evident from NASA's images, flood zones cover areas of business districts, residential master projects, and key highways of the city. This factor may negatively impact the long-term assessment of the profitability of real estate under the rental model.
The decline in tourist attractiveness due to safety concerns may also affect capitalization rates in the affected areas. These data highlight the need for a systematic approach to analyzing and accounting for climate risks in long-term urban planning and real estate investment. Furthermore, the consequences of flooding may reduce revenues in the tourism sector, including hotels, restaurants, and entertainment venues, which will impact employment levels and the economic stability of the city. The baseline data from NASA's image analysis could serve as a foundation for developing damage reduction strategies, infrastructure planning, and enhancing the resilience of Dubai's areas to similar events in the future.
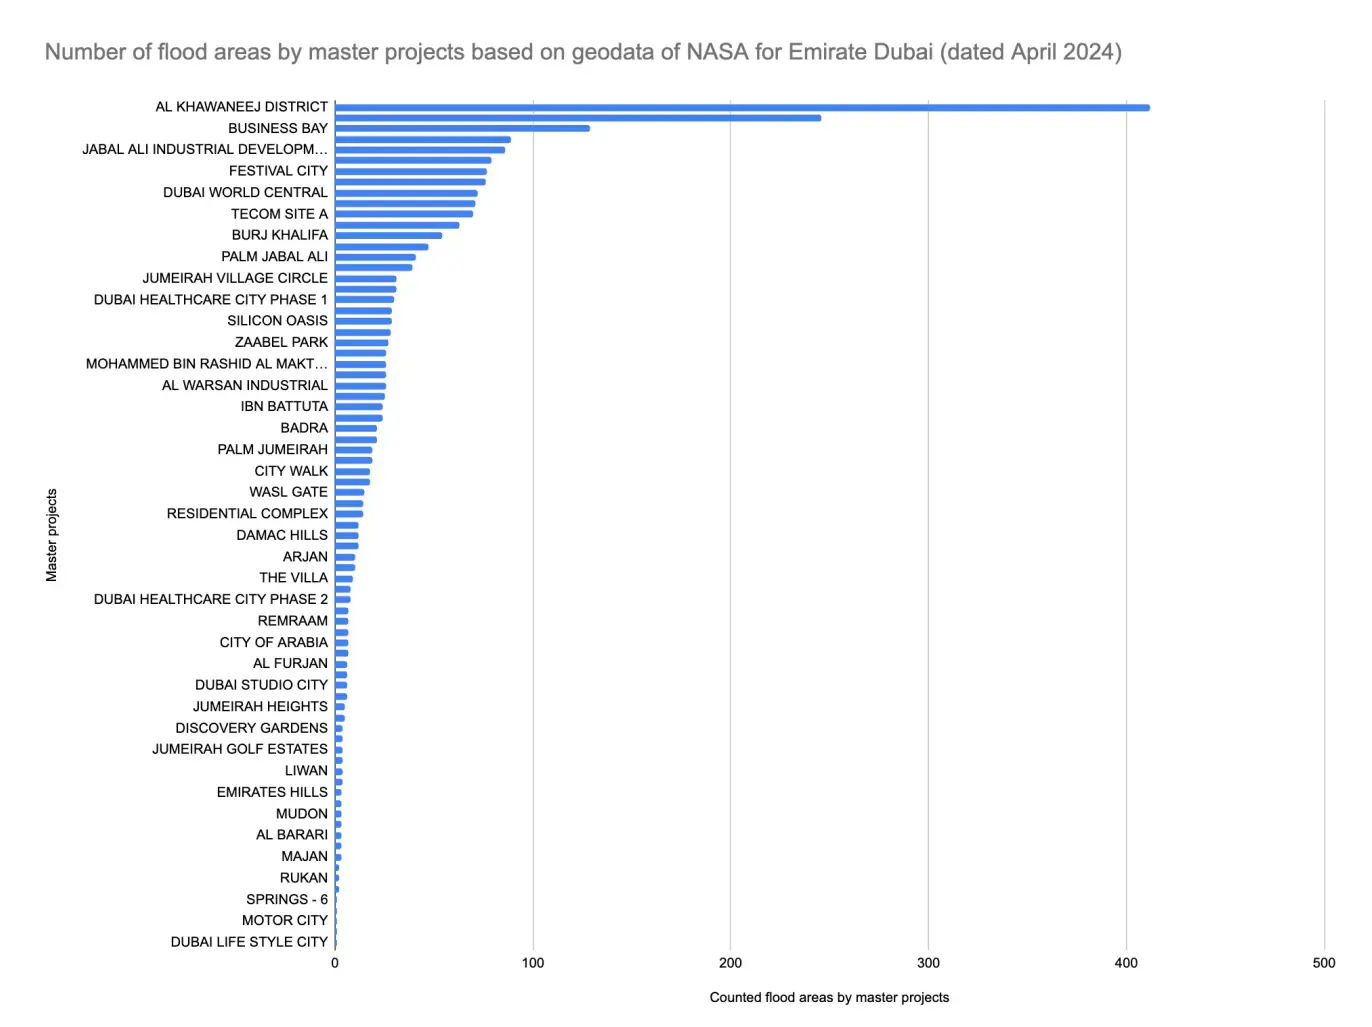 Fig. 4. Distribution of the number of flood zones by master development projects in the Emirate of Dubai based on NASA data (as of April 2024).
Explanations for Figure 4:
- Regardless of the segmentation of development projects (economy, business, or premium) and the level of accompanying infrastructure in the adjacent areas, heavy rainfall has affected at least 147 out of 224 districts*, which accounts for 65.6% of the territory of Dubai.
- The ranking of flood zones by area (Table 1) shows how different districts and master projects have been affected by precipitation, highlighting the complex terrain of the city.
- Measurements of the heights of the centroids of the districts relative to the level of the Persian Gulf indicate significant differences in the relief of the urban agglomeration.
- Heavy one-time precipitation acted as a stress test for Dubai's drainage systems. The excess of precipitation over the capacity of the drainage infrastructure led to a temporary transport collapse, highlighting the need for modernization and strengthening of urban infrastructure to withstand extreme climate conditions.