Geoanalysis of Dubai Retail Locations by Transport Accessibility
Smart Indexes geo‑analytics allows investors and developers to evaluate the potential of retail locations by combining infrastructure data and a consistent retail‑asset classification.
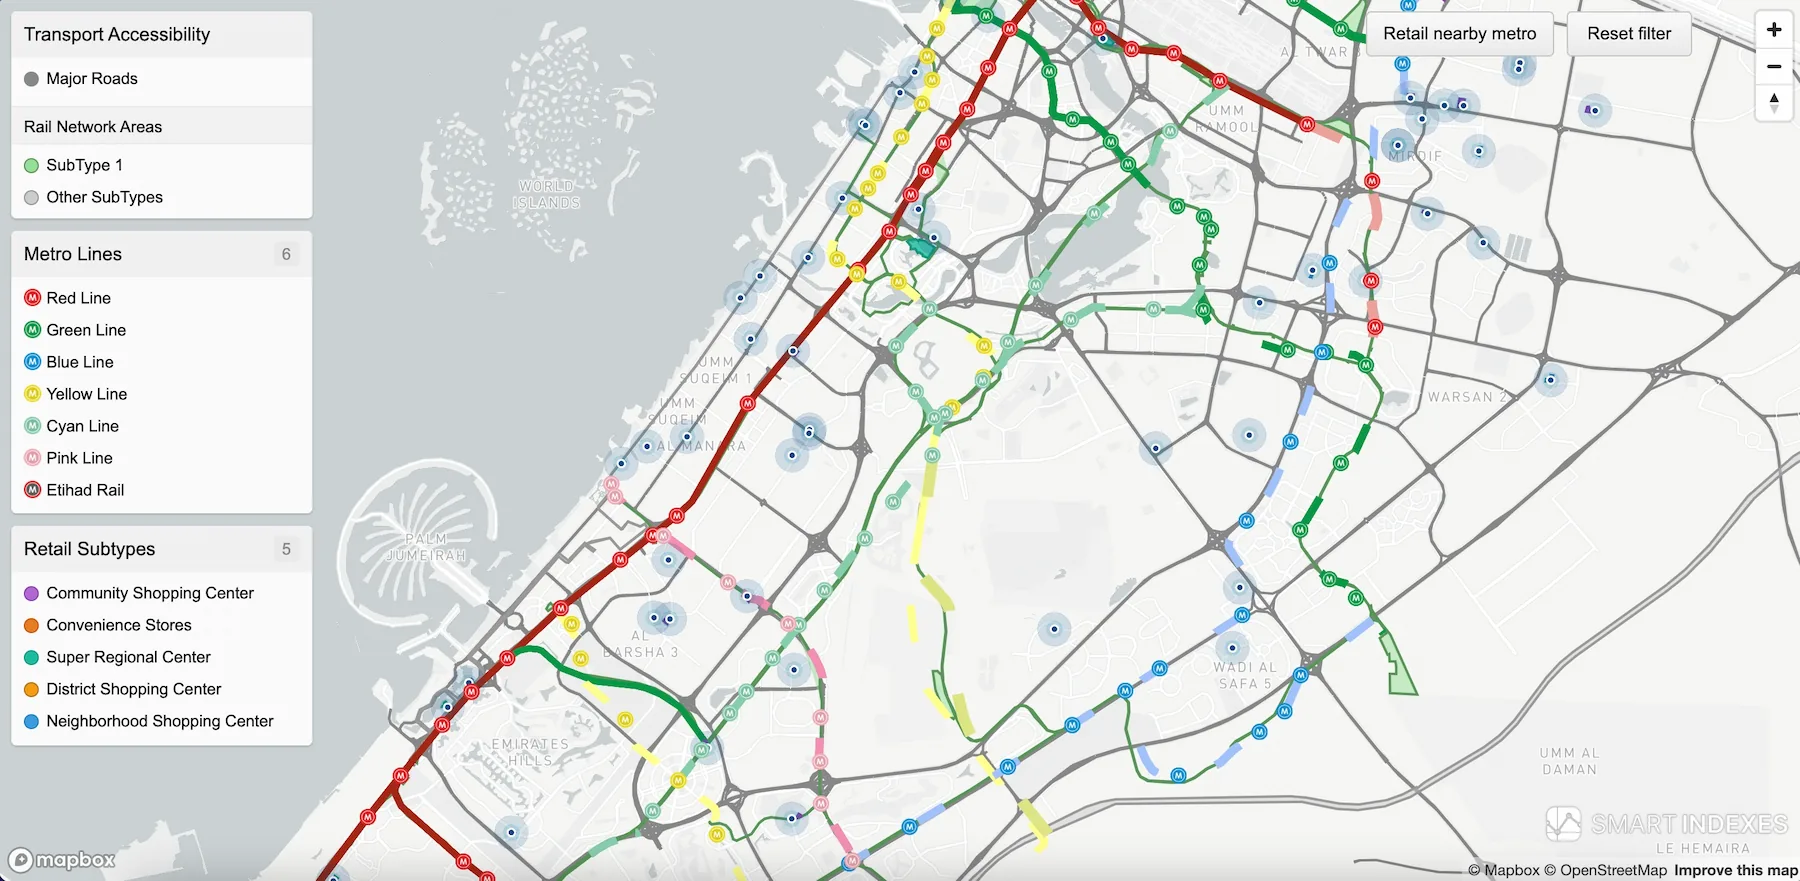 Fig. 1. Retail classification versus transport accessibility on the Dubai map.
Infrastructure Base
Dubai Metro 2025‑2030 — existing and planned metro lines and stations (2025–2030) help gauge the widening coverage of new districts.
Main roads and highways — Dubai’s primary arterials illustrate car‑traffic accessibility to retail destinations.

Retail‑Asset Classification
The analysis applies widely accepted retail classes based on location, footprint and catchment size.
Convenience StoresМагазины шаговой доступности
Key metrics:
- Ground‑floor retail in residential buildings
- Floor area: less than 300 m²
- Catchment: up to 3,000 residents
Highlights:
- No anchor tenants
- Assortment: groceries, beverages, hygiene items, small household goods

Neighborhood Shopping CenterМикрорайонный торговый центр
Key metrics:
- Located within Dubai’s communities
- Floor area: under 3,000 m²
- Catchment: up to 3,000 residents
Highlights:
- Situated away from primary streets
- Daily‑needs goods and services
- Anchor tenant may be absent
District Shopping CenterРайонный торговый центр
Key metrics:
- Located within Dubai’s communities
- Floor area: 3,000–10,000 m²
- Catchment: up to 40,000 residents
Highlights:
- 5–10‑minute drive or transit time
- Anchors: supermarket, pharmacy
- Daily‑needs goods and services
Community Shopping CenterОкружной торговый центр
Key metrics:
- Situated in high‑demand areas
- Floor area: 9,000–20,000 m²
- Catchment: up to 150,000 residents
Highlights:
- Proximity to major highways
- Anchors: supermarket, children’s goods
- Assortment: clothing, furniture, non‑food goods, leisure
Super Regional CenterРегиональный торговый центр
Key metrics:
- Located in peak‑demand areas
- Floor area: 30,000–45,000 m²
- Catchment: more than 150,000 residents
Highlights:
- 30–40‑minute travel time
- Several large department stores
- Wide assortment plus leisure and services
.webp "Fig. 2. Searching for retail points near metro stations") Fig. 2. Identifying retail points within 500 m of metro stations.
Fig. 2. Identifying retail points within 500 m of metro stations.
Transport‑Accessibility Geo‑analytics
Smart Indexes tools allow you to:
- Show retail facilities within a 500‑metre radius of any metro station.
- Analyse accessibility for both current and future stations.
- Filter locations by retail subtype (e.g. supermarket, shopping centre).
Retail nearby metro — filters retail points within 500 m walking distance of a metro station.
.webp "Fig. 3. Filtering retail points by subtype within walking distance of metro stations") Fig. 3. Filtering retail points by subtype near metro stations.
Fig. 3. Filtering retail points by subtype near metro stations.
Demo Mode
An interactive demo titled Retail (transport accessibility + classification) is available on request.
Conclusion
Geoanalysis driven by infrastructure data provides a rational basis for locating, developing and valuing retail assets. Smart Indexes combines classification, transport accessibility and visualisation in one system.
Subscribe to our Telegram channel and stay up to date with Smart Indexes updates.
Subscribe

