GeoAnalytics of Dubai, UAE
About the Product
GeoAnalytics is a location-based analytics platform developed by Smart Indexes for real estate professionals and institutional users — including investors, developers, insurance companies, and business analysts. Its primary goal is to deliver a map-driven interface that combines spatial data, economic indicators, and risk analysis. The product is currently under development and expected to launch in 2026.
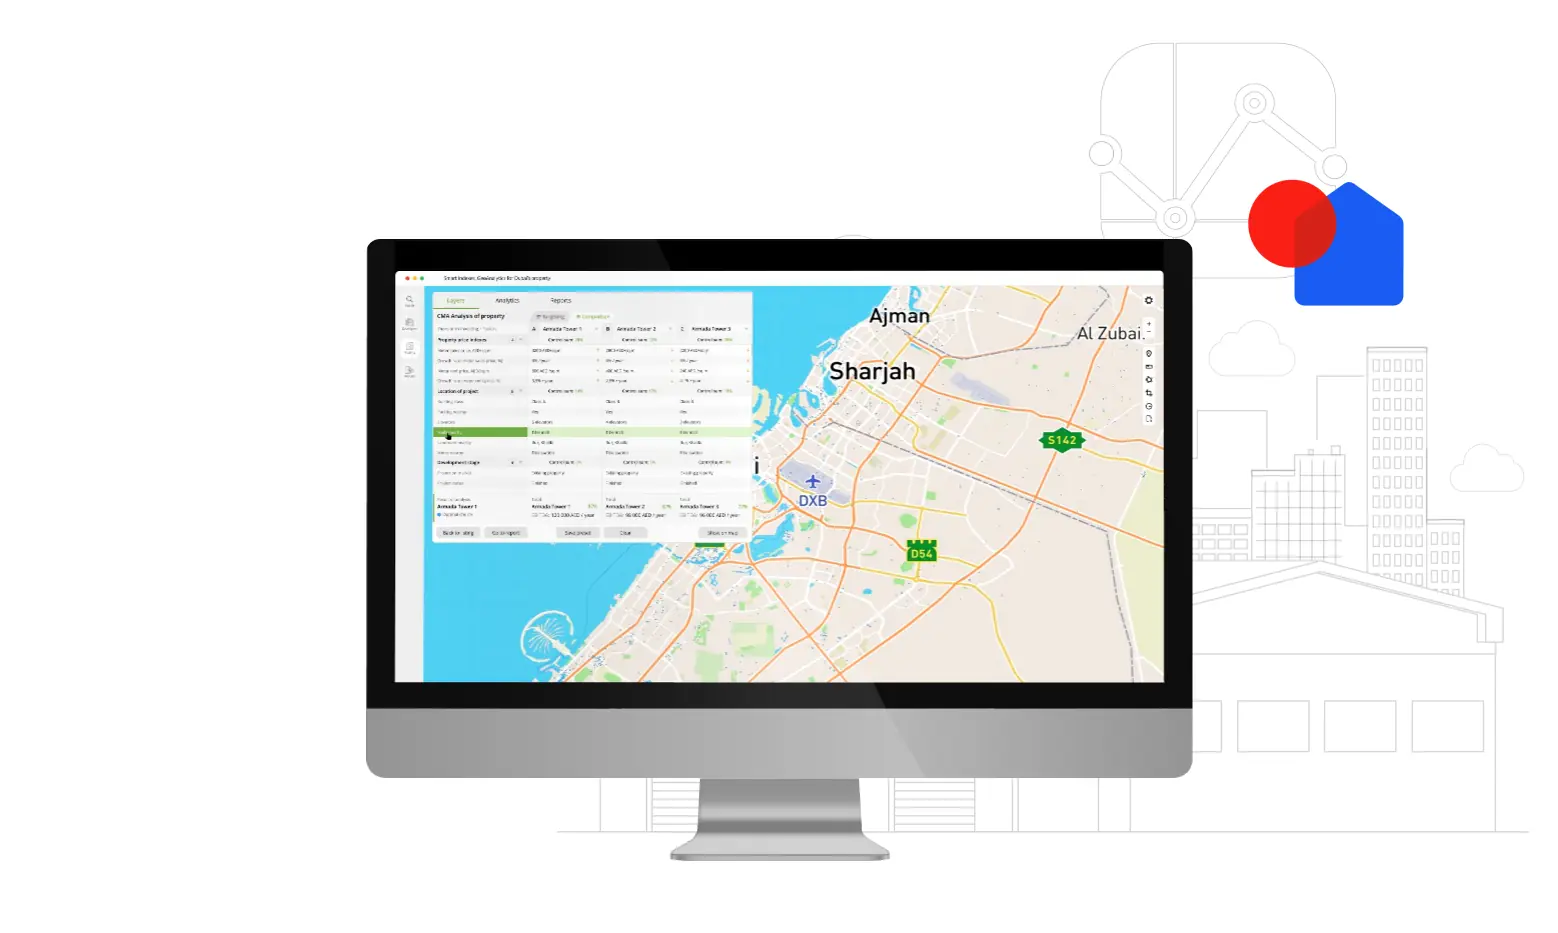 CMA analysis of real estate in Dubai, UAE in product GeoAnalytics
Key Benefits of GeoAnalytics
Dubai’s property market is rapidly evolving, but growth comes with local risks: flood zones, crime rates, demographic shifts, and overbuilt areas. GeoAnalytics is designed to address these issues by providing access to a full-stack GIS platform with risk overlays and investment-grade metrics.
Target Audience
GeoAnalytics is designed to serve professionals across multiple industries, including:
- Private and institutional investors
- Real estate developers and brokers
- Banks, insurers, and asset managers
- Marketing and logistics professionals
Key Features
Smart Indexes presents key features of product GeoAnalics to detailed analysis of interesting location on map of Emirate Dubai, UAE.
- Flood risk levels, crime statistics, and transport accident rates on the map of Dubai
- Cap rate heatmaps and price indices for sales and rentals (per sq.m)
- Population growth and density layers by district
- Transport accessibility scoring (metro, roads, DXB proximity)
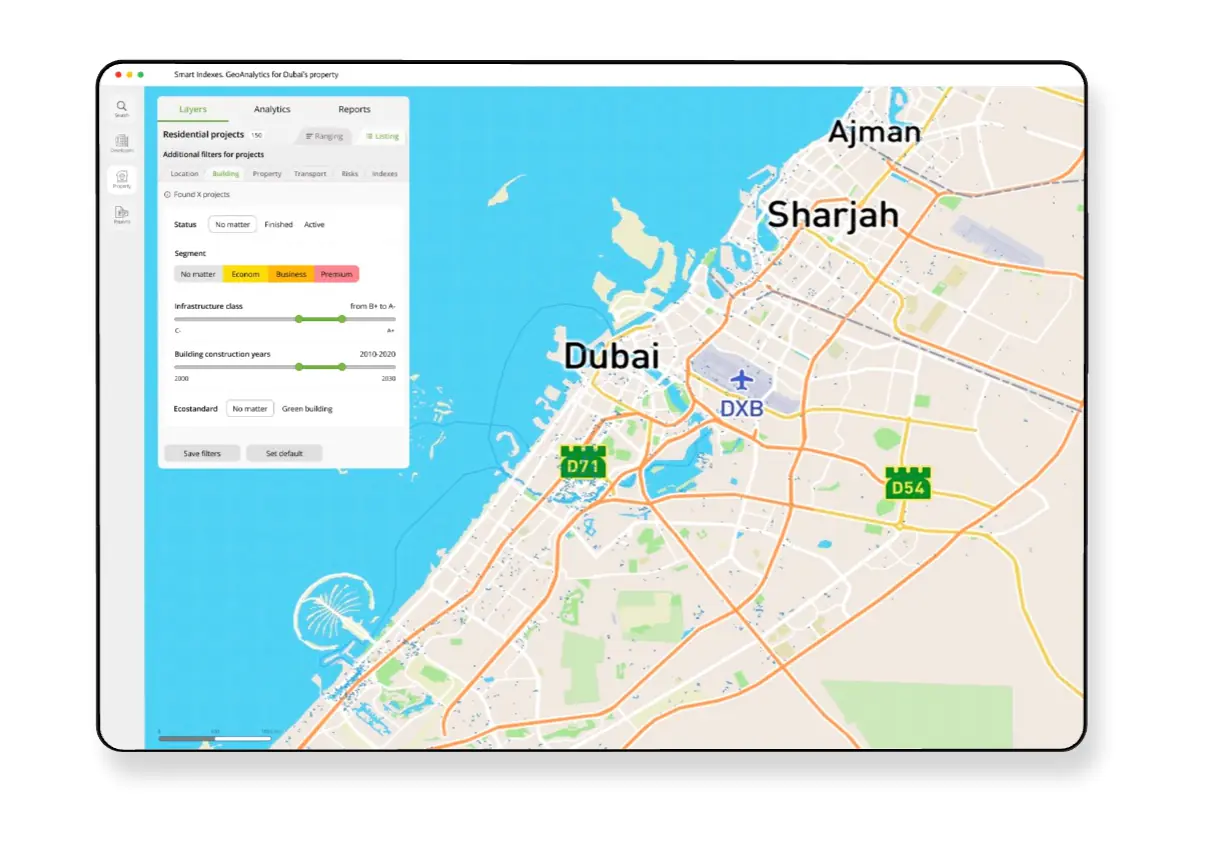 Filtering of residential development projects in GeoAnalytics for location Dubai, UAE
Use Cases: How Investors Can Apply GeoAnalytics
Use Case #1: Comparing Developers in Dubai
Users can browse a list of registered developers using various filters — such as reputation ratings or the number of active projects. GeoAnalytics will also provide charts and summaries of each developer’s portfolio, categorized by project status (e.g., off-plan, under construction, completed).
Side-by-side comparisons will allow users to evaluate developers based on project count, location, risk levels, and overall investment potential.
Use Case #2: Selecting a Developer’s Project by Market Segment
From a developer’s profile, users can explore a categorized list of their projects. Projects are divided into Off-Plan and Existing property segments. Users can select projects either from the list or directly from the map.
Once selected, users are guided from the Developer section to the Property section, where detailed project analytics and building data are available for review.
Use Case #3: Comparative Market Analysis (CMA)
Imagine an investor wants to compare two residential master developments in Dubai. Using GeoAnalytics, they can analyze flood risk, cap rates, crime levels, and proximity to infrastructure — side by side. This enables data-driven investment decisions in minutes, instead of weeks of manual research.
Additional use cases will be added as the product evolves. Smart Indexes’ technical team will provide step-by-step guidance to users as GeoAnalytics becomes ready for everyday use.
For more information, visit the Knowledge Base section on the official Smart Indexes website.
Demo Preview: What You’ll See in 2026
The product will feature a highly responsive web interface with map layer toggles, geosearch, and dynamic metric filters. Users will be able to select any building, project, or district, visualize it in 3D, and export customized analytical reports. The platform will also support accessibility features, including screen reader compatibility and colorblind-friendly modes.
Technology Stack
GeoAnalytics is being built using:
- Next.js (frontend framework)
- Tailwind CSS (for styling)
- MapBox with WebGL via Deck.gl (for high-performance mapping)
The backend is powered by FastAPI and PostgreSQL, optimized for fast spatial queries and efficient analytics delivery.
Status and Launch
As of April 2025, GeoAnalytics is in advanced development. A closed beta version is being tested with selected partners. The public release is scheduled for Q2–Q3 2026, with future expansion planned to other cities across the MENA region.
Want to Try It?
If you’d like to explore a demo or participate in early testing, click the Request Demo button at the top-right of this page. Our team will guide you through the interface and setup process.
Commercial Availability and Custom Use
GeoAnalytics is a commercial product designed for corporate clients in the real estate, finance, insurance, and logistics sectors. Demo access is available upon request for verified companies.
The platform offers customization options tailored to specific business needs — including data layers, analytical models, and integration with client systems.
Base pricing plans will be published upon official release in 2026.
GeoAnalytics integrates proprietary Smart Indexes APIs as a core data source. Full documentation for these APIs is available in the Knowledge Base.
If your company is interested in testing or adopting GeoAnalytics for internal decision-making or B2B integration, please contact our team via the “Request Demo” button or by email via the Contacts section.
Subscribe to our Telegram channel and stay up to date with Smart Indexes updates.
Subscribe

